Fig. 1.
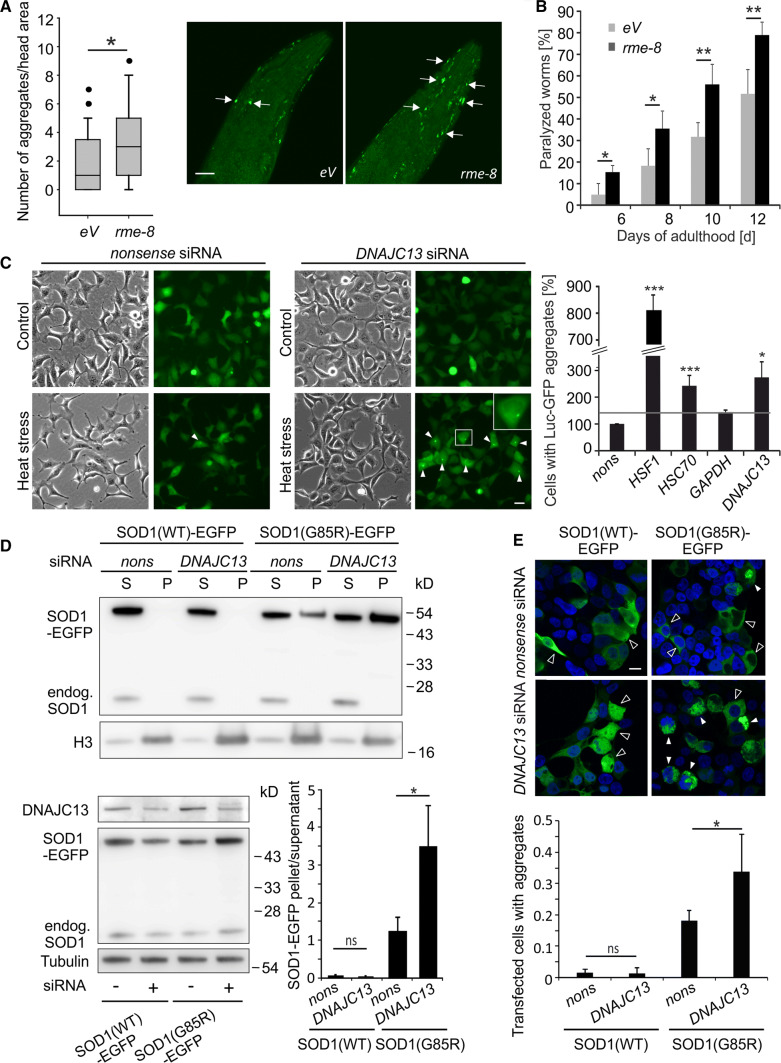
Knockdown of rme-8/DNAJC13 affects proteostasis. a, b C. elegans expressing Aβ42 in body wall muscle cells (CL2006) were fed with rme-8 RNAi or bacteria containing empty vector (eV) starting from the L4 stage. a Two-day adult animals show an increased number of thioflavin-positive accumulations (arrows) in the head region under rme-8 knockdown conditions. About 40 worms were counted and results were represented in a box-plot (n = 41/42; Mann–Whitney U test: *p ≤ 0.05). Micrographs represent maximum intensity projections of the head region of worms (scale bar: 20 µm). b CL2006 under rme-8 knockdown conditions developed an aggravated paralysis compared to control nematodes (eV). In total, 151 (eV) and 202 (rme-8) worms were analyzed (n = 4; mean ± SEM; t test: *p ≤ 0.05, **p ≤ 0.01). c Phase-contrast and epi-fluorescent pictures of HEK293A stably expressing Luc-GFP under control conditions or after heat stress and siRNA treatment. At least 200 cells per experiment and condition were analyzed and the number of cells with bright fluorescent Luc-GFP accumulations (arrowheads) was determined. The inset shows an enlargement of the boxed cell. Numbers were normalized and statistics were performed relative to the number of cells with accumulations under nonsense siRNA conditions (n = 3; mean ± SEM; t test: *p ≤ 0.05, ***p ≤ 0.001) (scale bar: 20 µm). d, e HEK293T cells were transiently transfected with EGFP-tagged wild-type SOD1(WT) or ALS-causing mutant SOD1(G85R) and nonsense siRNA or DNAJC13 siRNA. d Cell lysates were separated in a soluble (S) and an aggregate-enriched fraction (P) and the relative distribution of the SOD1-EGFP variants were quantified (n = 3; mean ± SD; t test: *p ≤ 0.05) (lower right panel). Endogenous SOD1 and histone H3 served as markers for the soluble and the aggregate-enriched fraction, respectively (upper panel). Representative Western blots showing the expression levels of transgenic SOD1-EGFP variants and DNAJC13 levels in total cell lysates (lower left panel). e Confocal images of HEK293T cells transfected with SOD1(WT) and SOD1(G85R) and nonsense or DNAJC13 siRNA. Images were taken with the same exposure conditions. Open arrows point to cells without aggregates; full arrows point to aggregates. The number of transfected cells with SOD1(G85R) aggregates was determined (n = 4; one-way ANOVA with Bonferroni correction; *p ≤ 0.05) (scale bar: 10 µm)

