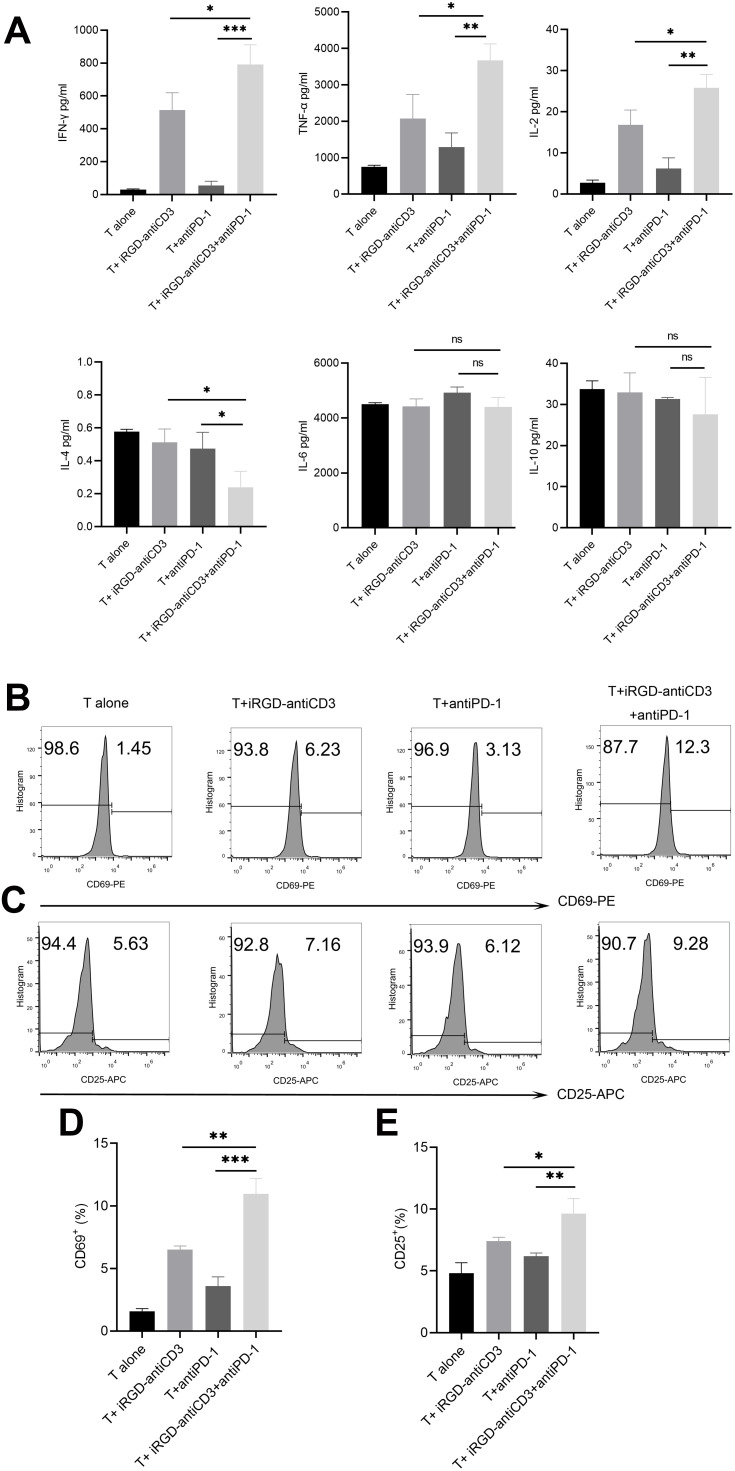
Figure 2.
The addition of PD-1 blockade restored activation of cord blood-derived T cells. (A) The co-culture supernatants were harvested and used for Th1/Th2 cytokines measurements using the BD CBA human Th1/Th2 flex set. Effector T cells and target MKN45 cells were incubated at an E:T ratio of 40:1 for 24 hr. All values were shown as mean ± the SEM of triplicate measurements and repeated three times with similar results. T cell activation was assessed by measuring the expression level of CD69 after 6 hr of incubation (B) and CD25 after 24 hr of incubation (C) on the gated CD3 T cells by flow cytometry. (D) Bar graphs of CD69 expression. (E) Bar graphs of CD25 expression. Data shown are shown as mean ± SEM of 3 independent experiments, and a representative result is shown. n.s, not significant,***P < 0.001, **P < 0.01, *P < 0.05.

