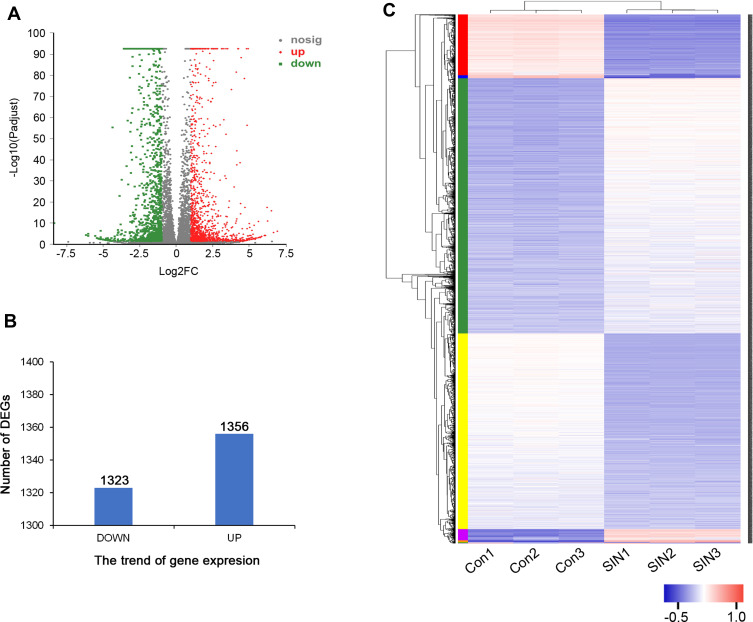
Figure 2.
Differentially expressed genes (DEGs) between different treatment groups. (A) Volcano map of DEGs. The horizontal axis represents expression changes (log) of the genes in sinomenine and DMSO treated groups, while the vertical axis showed the statistical significance of the changes in gene expression. The discrepancy was more significant with smaller p values and bigger −log10 (corrected p-value). Each dot in the image represents one gene, the grey dots represent genes with no significant discrepancy, red dots were significantly up-regulated genes and green dots were significantly down-regulated genes. (B) The numbers of DEGs. There were 1323 down-regulated genes and 1356 up-regulated genes. (C) Heatmap of DEGs. Red represents high relative gene expression level and blue represents low relative gene expression level. Con: groups of HeyA8 cells treated with DMSO, SIN: groups of HeyA8 cells treated with sinomenine.

