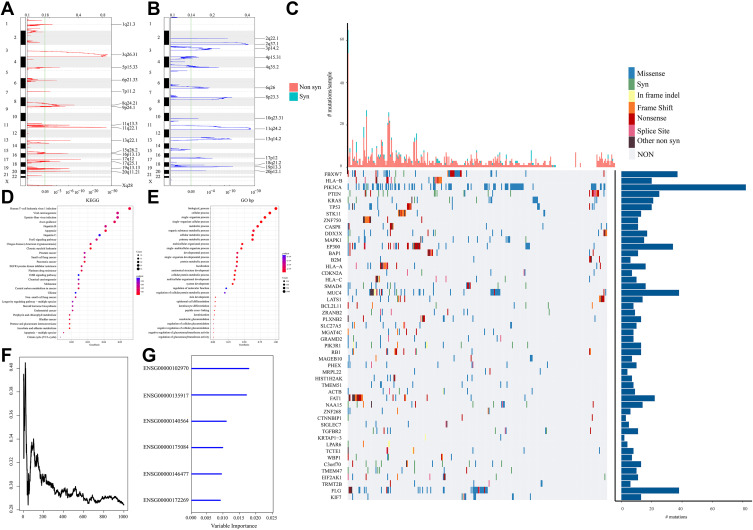
Figure 1.
(A) Significantly amplified segments in the CC genome. (B) Significantly deleted segments in the CC genome. (C) The top 50 genes with the most significant p values. The upper histogram represents the total number of synonymous and nonsynonymous mutations in the 50 genes from each patient, and the right histogram represents the mutation proportion of 50 genes in all samples. (D) A total of 839 genes with significant copy number variation and mutations were included in the KEGG pathway analysis. (E) A total of 839 genes with significant CNV and mutations were included in the GO biological process analysis. (F) The relationship between prediction error rates and the number of separate trees. (G) The out-of-bag importance rank of the top 6 genes.

