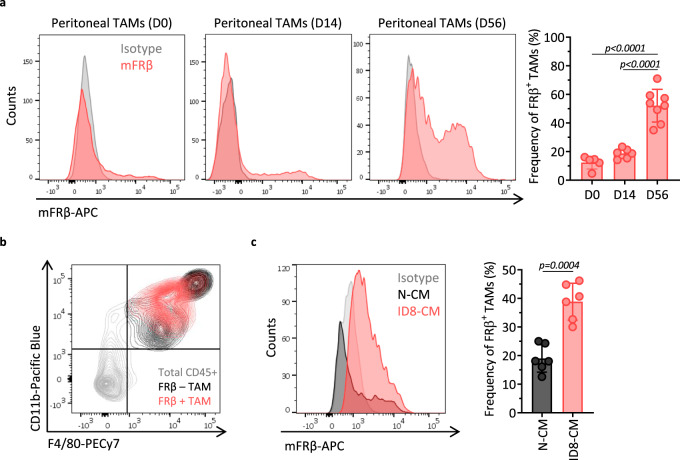
Fig. 1. FRβ is expressed by TAMs in the ovarian cancer TME.
a mFRβ expression in peritoneal TAMs from ID8 ovarian tumor-bearing C57BL/6 mice obtained at indicated time points after i.p. tumor inoculation. Representative histograms (gray–isotype, red–anti-mFRβ, left panel) and frequency of FRβ+ TAMs (defined as live, CD45+CD11b+F4/80+ cells, right panel) are shown. Mean ± SD are represented (n = 5 mice for D0, 6 for D14, and 8 for D56 groups). b Representative flow plot demonstrating the gating strategy for TAMs by looking at CD11b (Y-axis) and F4/80 (X-axis) expression. Total CD45+ cells are depicted in gray, FRβ+ population of TAMs in red, and FRβ− TAMs in black. c FRβ expression in peritoneal macrophages obtained from tumor-free mice and exposed for 72 h to nonconditioned media (N-CM) or ID8-conditioned media (ID8-CM). Representative histograms (gray—isotype, black—N-CM, and red—ID8-CM, left panel) and frequency of FRβ+ macrophages (defined as live, CD45+CD11b+F4/80+ cells, right panel) are shown. Mean ± SD from two pooled independent experiments is represented (n = 6 mice). P values by a one-way ANOVA with Tukey’s multiple comparison test and c a two-tailed paired t test are indicated. Source data are provided in the Source Data file.

