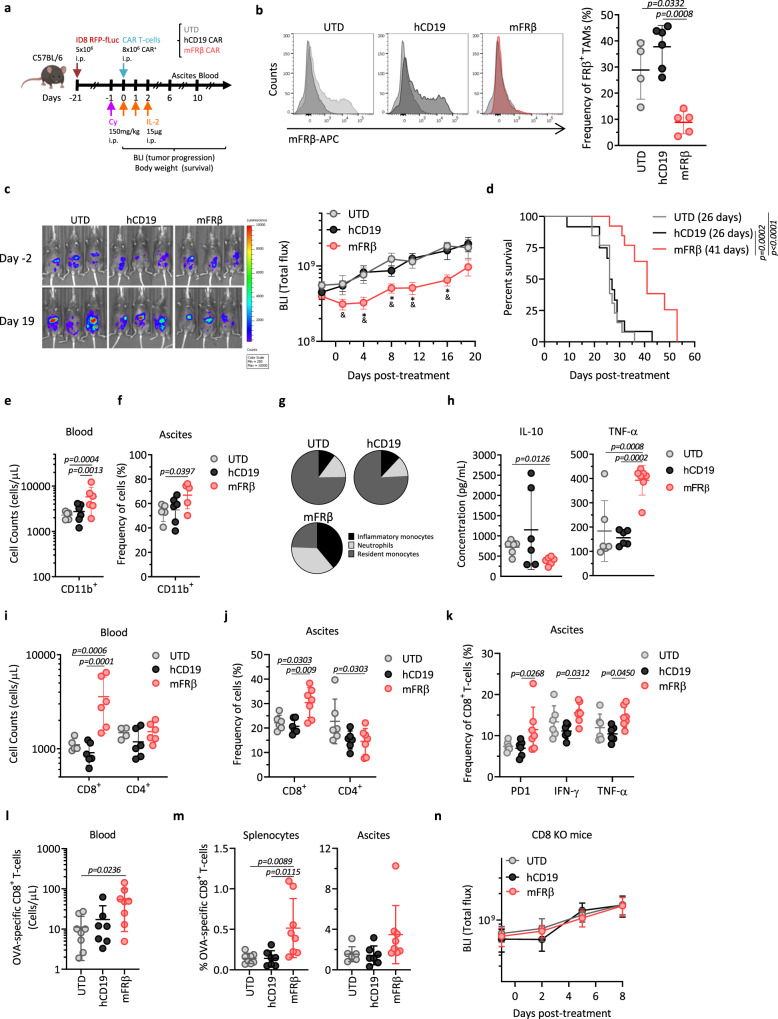
Fig. 5. Depletion of FRβ+ TAMs by mouse FRβ CAR-T cells in vivo delays tumor growth and reeducates the TME.
a Schematic representation of the in vivo study. b mFRβ expression in peritoneal TAMs 6 days after treatment. Representative histograms (left panel) and frequency of FRβ+ TAMs (pregated as live, CD45+CD11b+F4/80+, right panel) are shown (n = 4 mice for UTD, 6 for hCD19, and 5 for mFRβ). c Tumor progression as monitored by bioluminescence imaging (BLI). Representative images (left panel) and mean radiance (right panel) are shown. d Kaplan–Meier survival curves. Mean survival is indicated in the legend. c, d Data pooled from three independent experiments (n = 13 mice for UTD and mFRβ and 12 for hCD19). Concentration of e CD11b+ or i CD8+ and CD4+ T cells in blood at day 10 (n = 5 mice for UTD, and 6 for hCD19 and mFRβ). Frequencies of f CD11b+ cells (pregated on live, CD45+), j CD8+ and CD4+ T cells (pregated on live, CD45+CD3+), or k CD8+PD-1+, CD8+IFN-γ+ and CD8+TNF-α+ T cells (pregated on live, CD45+CD3+GFP−), in the ascites of mice at day 6 (n = 6 mice for UTD and hCD19 and 7 for mFRβ). g Pie charts representing the distribution of myeloid cell subsets (pregated on live, CD45+CD11b+): inflammatory monocytes (Ly6C+Ly6G−), neutrophils (Ly6CintLy6G+), and resident monocytes (Ly6C−Ly6G−) in ascites at day 6 (n = 5 mice for UTD and mFRβ and 6 for hCD19). h Production of IL-10 (left panel) and TNF-α (right panel) by peritoneal CD11b+ cells at day 6. Concentrations were determined by a cytokine bead-based assay after 48 h of incubation in the presence of 5 ng/mL of LPS (n = 6 mice per group). l, m The experiment depicted in panel (a) was performed using ID8.OVA tumor cells. l Concentration of CD8+ OVA-specific T cells in blood at day 8. m Frequency of CD8+ OVA-specific T cells (pregated on live, CD45+CD3+) in splenocytes (left panel) and ascites (right panel) at day 8 (n = 8 mice for UTD and mFRβ and 7 for hCD19). n The experiment depicted in panel (a) was performed in CD8 KO mice. Tumor progression was monitored by BLI (n = 6 mice for UTD and hCD19, and 7 for mFRβ groups). Data are represented as mean ± SD in panels (b, e, f, h–m) or mean ± SEM in panels (c, n). c P values calculated by a multiple two-tailed t test (mFRβ as compared to (*) the UTD group; or (&) hCD19) and exact values are indicated as follow: D1 & = 0.0363; D4 * = 0.0264, & = 0.0131; D8 * = 0.0080, & = 0.0274; D11 * = 0.0109, & = 0.0022; D16 * = 0.0001, & = 0.0244. P values by a (d) log-rank Mantel–Cox test; a b, e f, i, j, k two-way ANOVA with Tukey’s multiple comparison test; or a h, l, m one-way ANOVA with Tukey’s multiple comparison test are indicated. Data shown are representative from n one or e–m two independent experiments. Source data are provided in the Source Data file.

