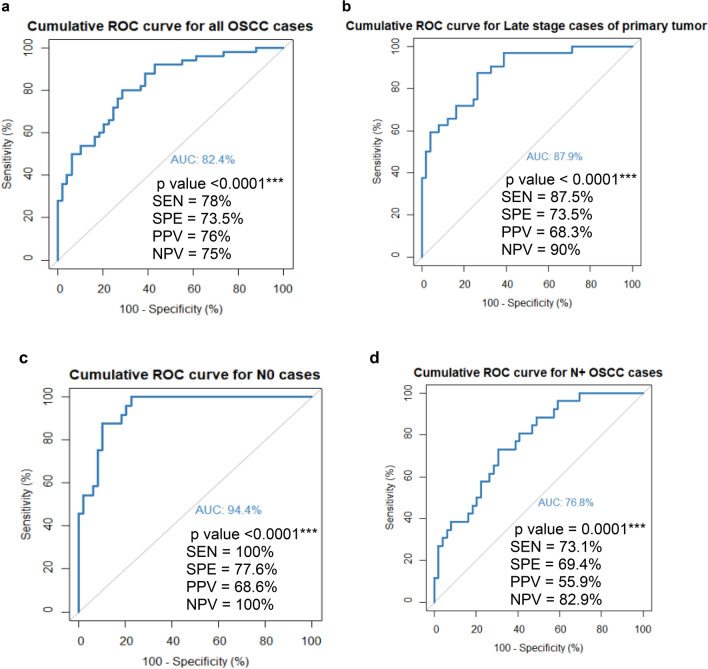
Figure 6.
Cumulative ROC curve for the risk prediction models. (a) ROC curve for all the cases and controls for the model formed with the proteins AHSG, KRT6C and AZGP1 (b) ROC curve for the cases of late stage of primary tumour (T3/T4) and controls for the model formed with the proteins AHSG, KRT6C and AZGP1 (c) ROC curve for the cases with N0 stage and controls for the model formed with the proteins AHSG, KRT6C, AZGP1 and BPIFB2 (d) ROC curve for the cases with N+ stage and controls for the model formed with the proteins KRT6C and AZGP1. The characteristics of the ROC curve are mentioned in the inset of each figure. AUC area under the curve, SEN sensitivity, SPE specificity, PPV positive predictive value and NPV negative predictive value.

