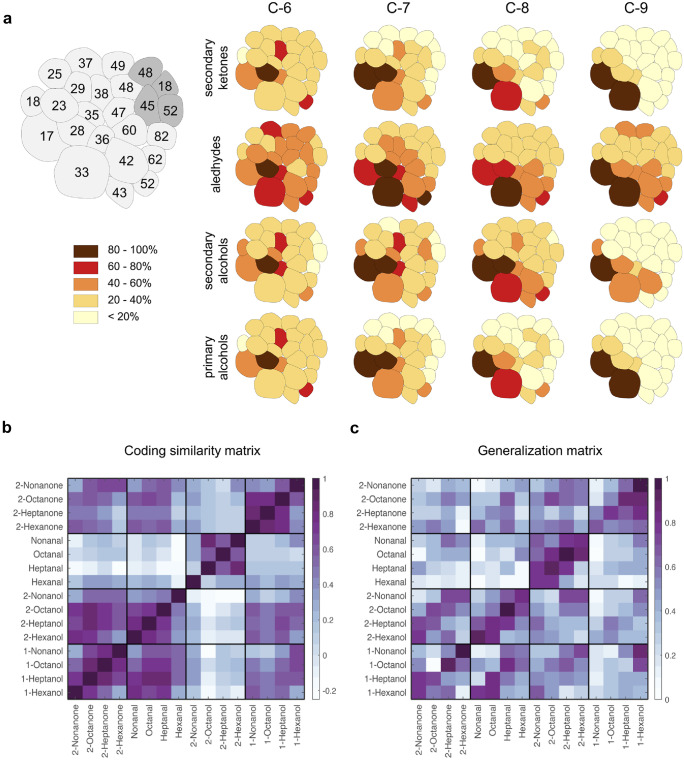
Fig. 1.
Comparing neurophysiological and perceptual similarity of odorants. a Neural correlates of different olfactory stimuli based on Sachse et al. 1999. On the left, a schematic antennal lobe with glomerular labels (light gray, glomeruli innervated by T1 antennal nerve tract; dark grey, glomeruli innervated by T3 antennal nerve tract). On the right, glomerular response maps of 16 odorants, arranged according to their chemical structures (vertical: ketones, aldehydes, secondary and primary alcohols) and carbon chain lengths (horizontal). Response intensity is color coded in five bins, and percentage of glomerular responses is referred to the maximum response intensity to a given odorant. b The glomerular response maps in a were used to generate an olfactory response similarity matrix based on the Pearson’s correlation coefficient between glomerular response maps. c Olfactory generalization matrix based on Guerrieri et al. (2005). After three conditioning trials, 2048 bees were tested for PER to four random stimuli (among which the conditioned one). The response rates to conditioned and novel stimuli are shown on a scale from 0 (= no bee showed PER) to 1 (all tested bees showed PER). A correlation analysis between the two matrices shows that 54% of the behavioral variability can be explained by odorant representation within the antennal lobe (Guerrieri et al. 2005)

