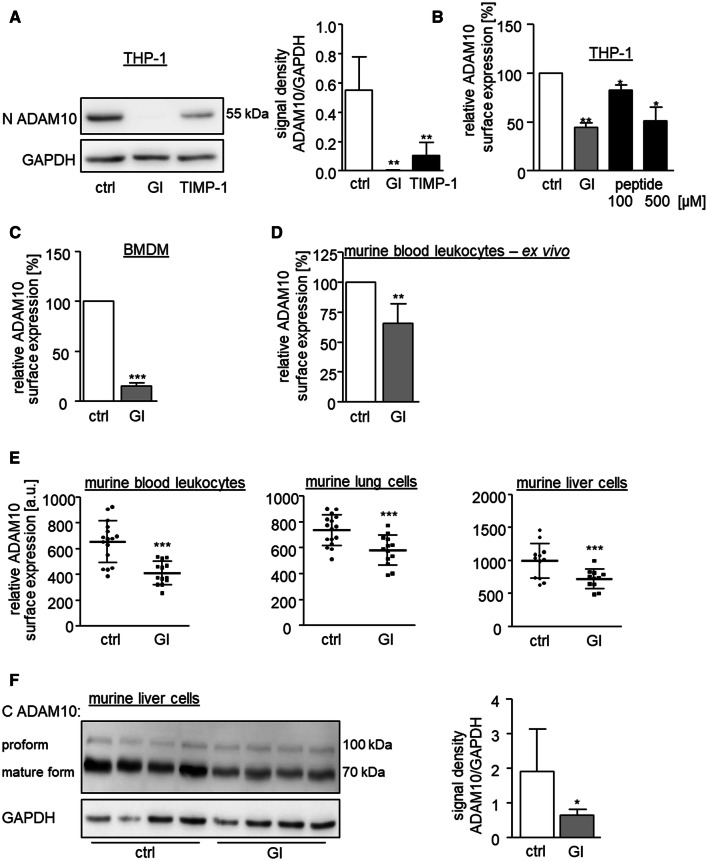
Fig. 6.
In vitro and in vivo relevance of ADAM10 downregulation. a THP-1 cells were treated with 200 nM recombinant TIMP-1, 10 μM GI or vehicle control for 24 h and subsequently studied for expression of mature ADAM10 by western blot analysis of cell lysates with antibodies against the N-terminus of ADAM10 and GAPDH as loading control. Data are shown as representative western blot and as relative changes of band intensity determined by densitometric analysis of three independent experiments. b THP-1 cells were treated with 10 μM GI, the indicated amounts of a specific ADAM10 peptide substrate or vehicle for 2 h and subsequently analyzed for surface expression of ADAM10 by flow cytometry. Geometric mean fluorescence intensity was calculated in relation to that of the untreated control (n = 3). c Isolated murine BMDMs were treated with 10 μM GI or vehicle control for 24 h and subsequently analyzed for surface expression of ADAM10 by flow cytometry. d Isolated murine peripheral blood leukocytes were treated with 10 μM GI, 10 μM TAPI or vehicle control for 2 h and subsequently analyzed for surface expression of ADAM10 by flow cytometry. In c, d, the geometric mean fluorescence of the cells was calculated in relation to that of the control and summarized as mean and SD of seven (c) or five (d) independent experiments. e, f Mice received daily intraperitoneal injections of 200 mg/kg bodyweight GI or DMSO as vehicle control. After 13 days, animals were sacrificed and ADAM10 surface expression on isolated peripheral blood leukocytes, lung or liver cells (e) was studied by flow cytometry. Data are shown as geometric mean fluorescence (n ≥ 11). f The western blot analysis of lysed liver tissue of four GI-treated and four control-treated mice with an antibody against the C-terminus of ADAM10 and GAPDH as loading control and the relative changes of band intensity of mature ADAM10 determined by densitometric analysis

