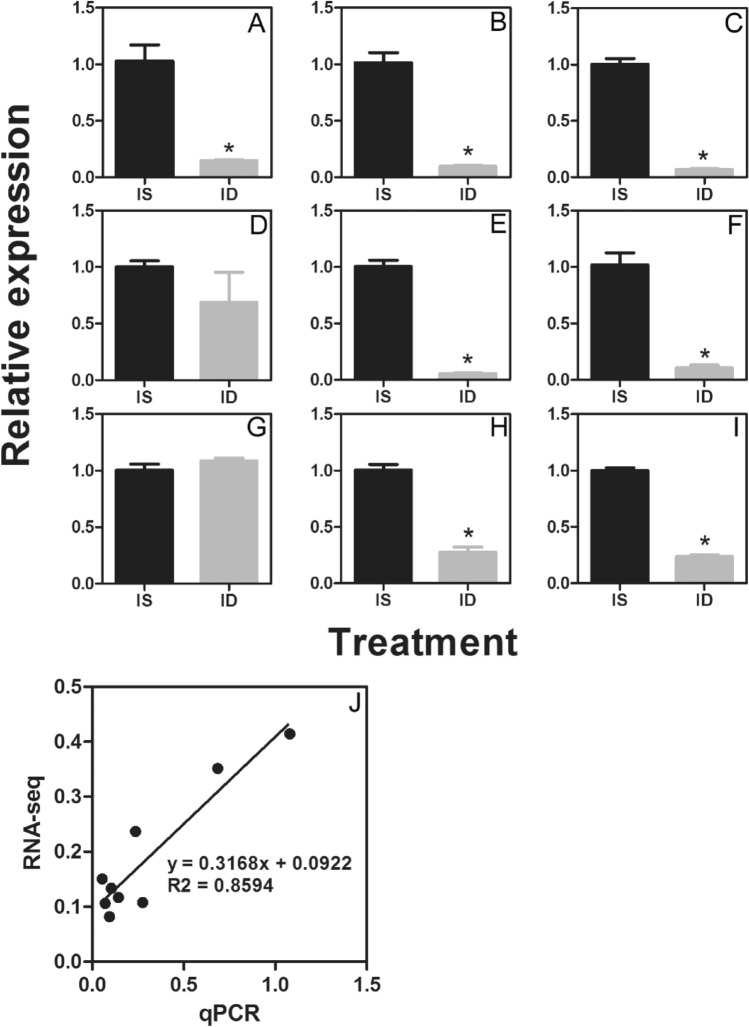
Fig. 3.
qRT-PCR confirmation for differentially expressed genes from digital gene expression analysis. a–i refer to the transcript levels of 9 randomly selected different expressed miRNA, including 7 known and 2 novel miRNA. The bars represent SE (n = 4). J refers to the comparison between the log2 of gene expression ratios obtained from RNA-seq data and qRT-PCR. IS refers to Fe-sufficiency, ID refers to Fe-deficiency

