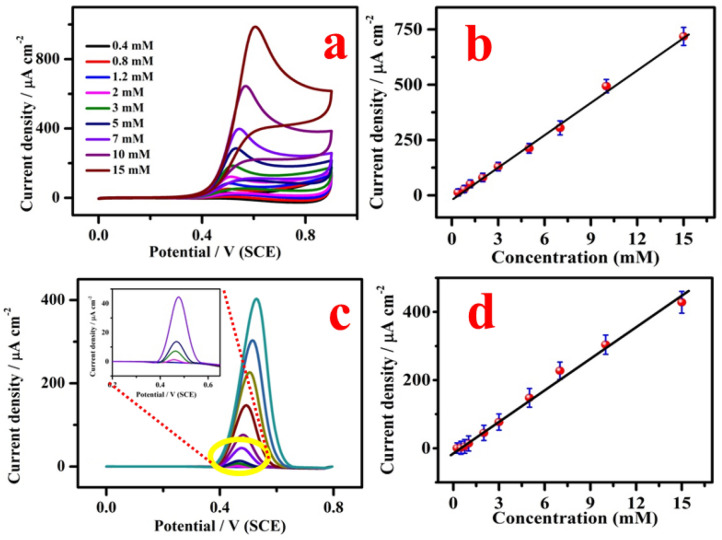
Figure 9.
(a) CV of CuO/GCE in 0.1 M PBS (pH 7.0) containing 0.4, 0.8, 1.2, 2.0, 3.0, 5.0, 7.0, 10.0 and 15.0 mM of SO32−; (b) corresponding calibration curve (n = 3). (c) Differential pulse voltammogram of CuO modified electrode in 0.1 M PBS pH 7 concentration ranges from 0.2, 0.3, 0.5, 0.75, 1.0, 2.0, 3.0, 5.0, 7.0, 10.0 and 15.0 mM of SO32−. Insert shows the low concentration region and (d) a plot of current density with respect to the concentration (n = 3). (DPV parameters: step potential = 0.0050 V; modulation amplitude = 0.0250 V; modulation time = 0.20 s and interval time-0.5 s).

