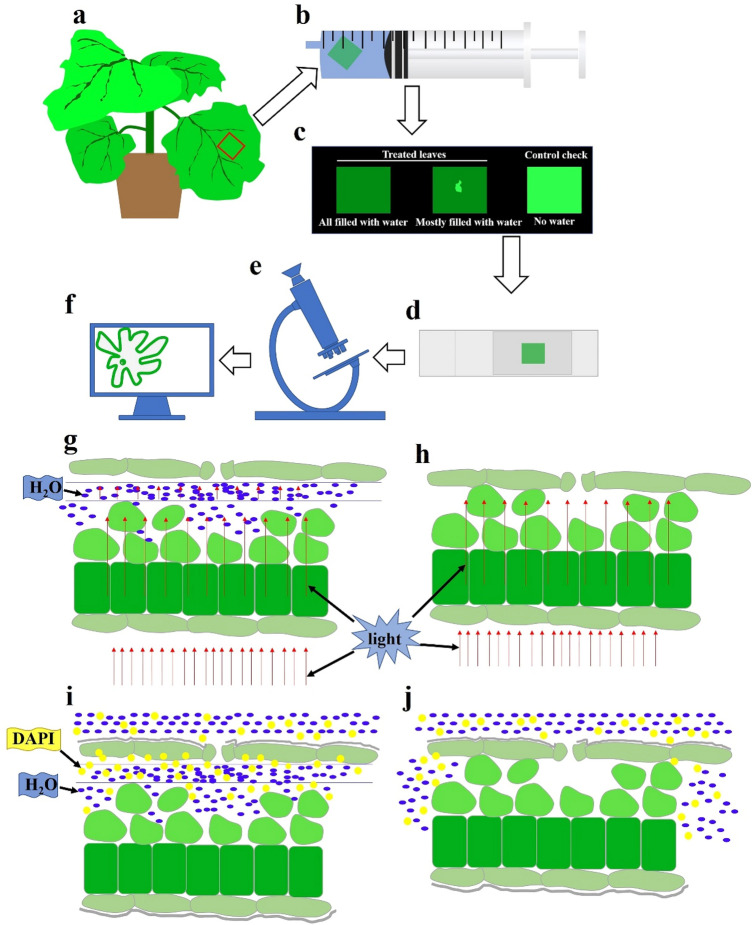
Fig. 1.
The flowchart and the principle of this method. a–f The procedures of this method. g The schematic diagram of the leaf structure after treatment, the space between lower epidermis (the upper side of the diagram) and the mesophyll tissue is filled with water. h The schematic diagram of the leaf structure of the control groups. i The schematic diagram of the leaf structure after treatment stained with DAPI. j The schematic diagram of the leaf structure of the control groups stained with DAPI. The red arrows indicate the light direction. Blue-dots represent water, yellow-dots represent DAPI, and gray lines on the epidermis represent the stratum corneum (color figure online)

