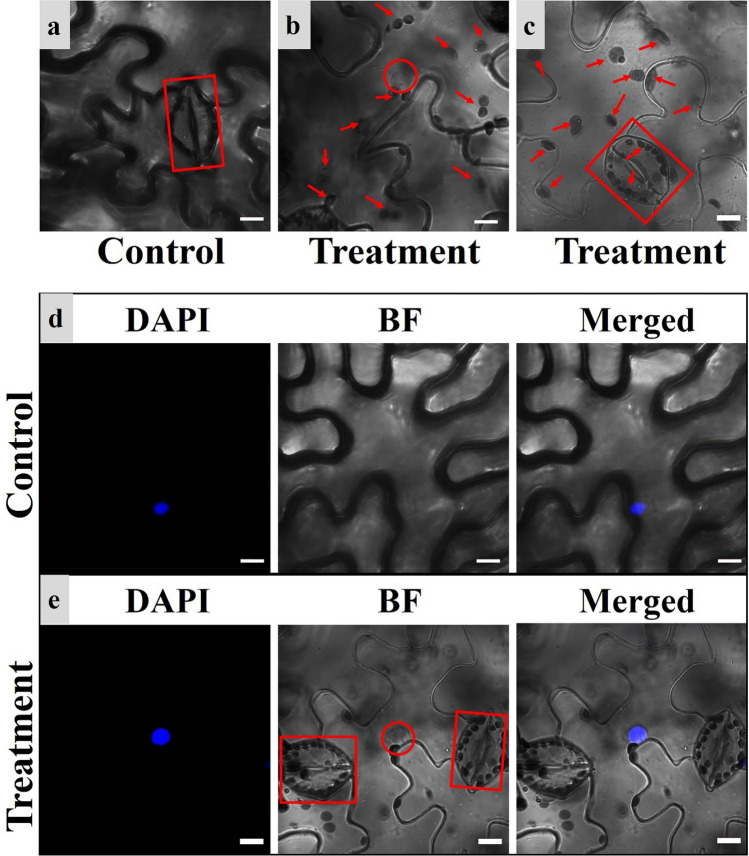
Fig. 5.
Images of the treatment groups and control groups under CSLM. a, d Images of the control groups. b, c, e Images of the treatment groups. The cytoarchitecture in the red frames are stomata; the red circle shows the nucleus; the red arrows point to the subcellular structures of other organelles; The cytoarchitecture in the red frames are stomata; the red circle shows the nucleus; BF, bright-field; DAPI (4,6-diamidino-2-phenylindole) indicates nuclear localization; Merged, merged image of BF and DAPI; the white bars indicate the scale (10 µm) (color figure online)

