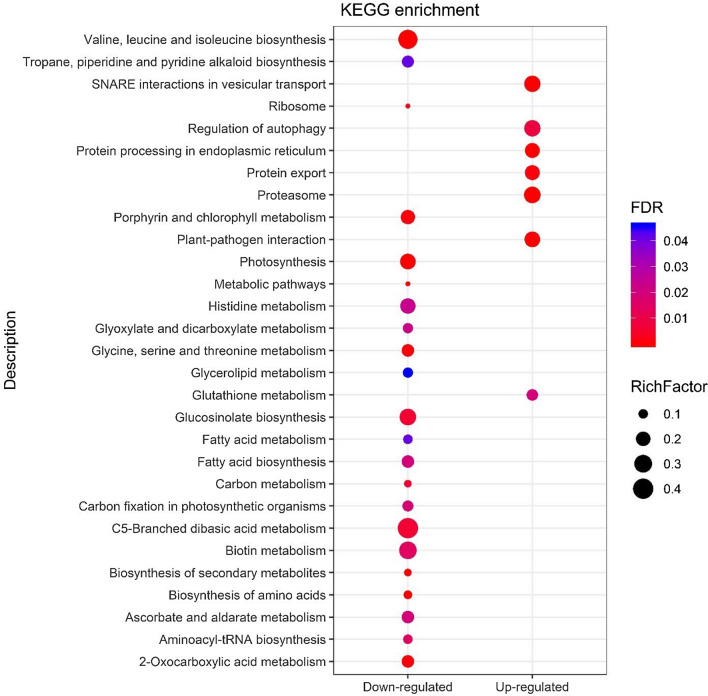
Fig. 4.
KEGG pathway enrichment analysis of DEGs in response to CMV and TuMV in Arabidopsis (FDR rate < 0.05). The y-axis shows the enriched KEGG pathways. The color and the size of pathways descriptions represent the FDR and the Rich Factor, respectively. Rich factor is the ratio of the gene number to the total gene number in that specific pathway

