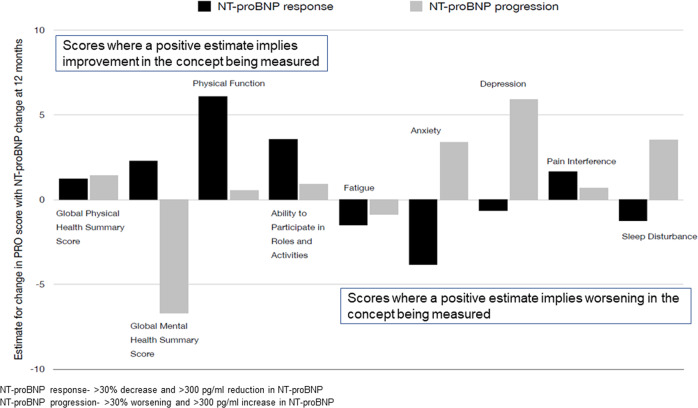
Fig. 2. Relationship between NT-proBNP response and change in PRO score at 12 months.
The figure shows the relationship between PRO change and NT-proBNP response/progression at 1 year, e.g. for the Physical Function domain, an NT-proBNP response (black bar) results in an improvement in physical function by an estimate of +6.08, whereas an NO-proBNP progression (grey bar) results in change in physical function by an estimate of +0.56. For Anxiety domain, an NT-proBNP response results in an improvement in anxiety (decreased Anxiety scores) by an estimate of −3.84, whereas an NT-proBNP progression results in worsening anxiety (increased Anxiety score) by an estimate of +3.39.

