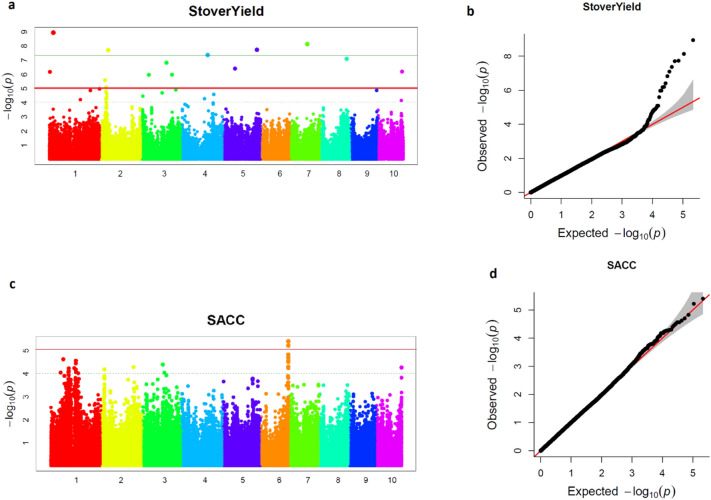
Figure 2.
GWAS of stover yield and saccharification efficiency in a maize MAGIC population. (a) Manhattan plot of the GWAS mixed linear model for Stover Yield. Single-nucleotide polymorphisms (SNPs) above the red horizontal line surpassed the p value threshold obtained by Bonferroni’s modification approach. (b) Quantile–quantile (Q–Q) plot of the GWAS mixed linear model for stover yield. (c) Manhattan plot of the GWAS mixed linear model for saccharification efficiency (SACC). Single-nucleotide polymorphisms (SNPs) above the red horizontal line surpassed the p value threshold obtained by the modification of Bonferroni approach (8.07E−06); (d) Q-Q plot of the GWAS mixed linear model for SACC.

