Figure 7.
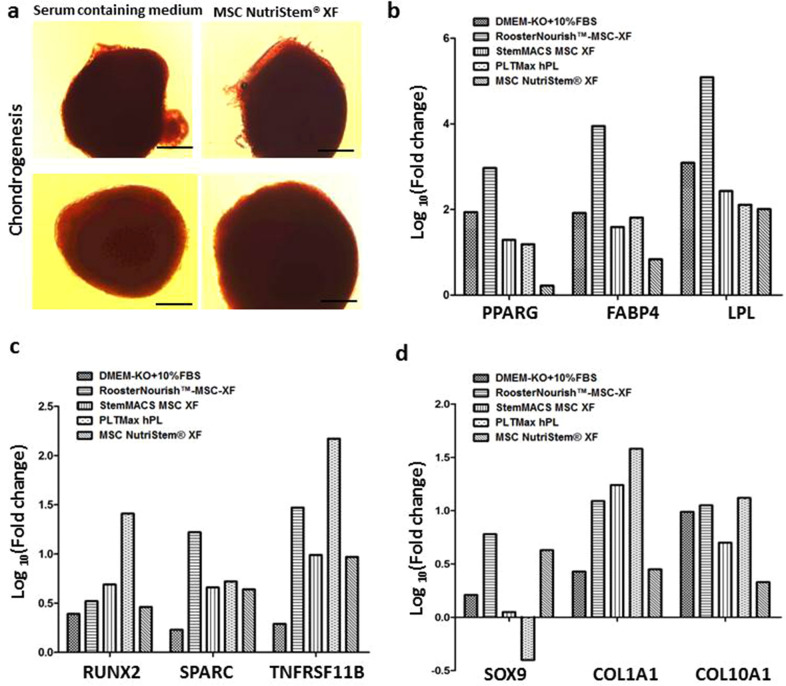
Chondrogenic differentiation and quantification of gene expression in the adipogenic, osteogenic and chondrogenic differentiated cells cultured in SFM/XFM and control medium. (a) Chondrogenic differentiation of BM-MSCs in MSC Nutristem XF in 96 well V- bottom plates as evident by 1% Safranin O staining. BM-MSCs cultured in serum containing medium was used as control. The images were captured at 10X magnification with scale bar of ∼100 μm. (b) Bar graph showing the fold change in the mRNA expression of PPARG, FABP4 and LPL genes in adipogenically differentiated cells relative to the uninduced control (undifferentiated) by real time PCR analysis. (c) Bar graph depicts the fold change in the mRNA expression of RUNX2, SPARC and TNFRSF11B genes in osteogenically differentiated cells relative to the uninduced control (undifferentiated). (d) Bar graph showing the fold change in the mRNA expression of SOX9, COL1A1 and COL10A1 genes in chondrogenically differentiated cells relative to the uninduced control (undifferentiated). The Y axis is represented as log10 fold change. The log10 fold change of uninduced controls is zero. The expression of these genes varied with one another among each of the media tested.

