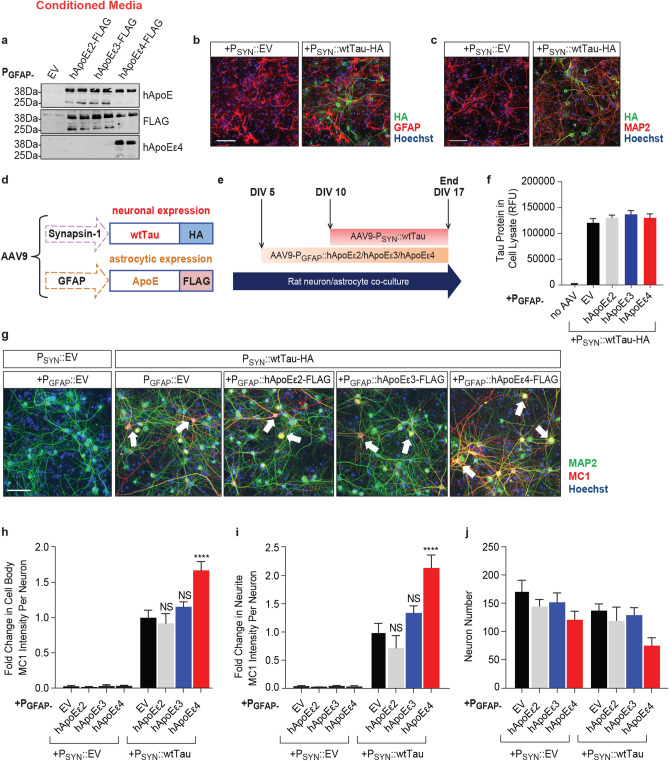
Figure 1.
Astrocytic hApoEε4 increases neuronal tau MC1 pathology without altering tau expression levels. Scale bar of representative images represents 50 µM. High-content imaging and its associated quantification represents data from one independent experiment. (a) Representative Western blot to detect released hApoE in the clarified conditioned media of co-cultures five days after transduction with PGFAP:: EV/hApoEε2/hApoEε3/hApoEε4 (n = 2 technical replicates/group). Full Western blot image can be found in Fig. S4 of Supplementary Information. (b) Immunocytochemistry to detect tau-HA in rodent co-cultures seven days after being transduced with PSYN::EV or PSYN::wtTau (DIV17). Cultures were co-stained with GFAP to label astrocytes and Hoechst to label nuclei. (c) Immunocytochemistry to detect tau-HA in rodent co-cultures seven days after being transduced with PSYN::EV or PSYN::wtTau (DIV17). Cultures were co-stained with MAP2 to label neurons and Hoechst to label nuclei. (d) Description of AAV vectors and constructs to express wtTau in neurons and hApoE in astrocytes. (e) Schematic illustrating the experimental paradigm to overexpress human ApoE in astrocytes beginning at DIV5, followed by the overexpression of wild type human tau in neurons beginning at DIV10 before experiment end at DIV17. (f) Quantification by AlphaLISA of HA-tagged human tau expression in cell lysates from co-cultures seven days after transduction with tau (DIV17). (n = 3 sample means/group). (g) Immunocytochemistry to detect MC1-positive tau in neurons (MAP2-positive cells) of co-cultures at DIV17. Hoechst stain was used to label nuclei. Arrow heads point to representative MC1-positive cell bodies and neurites. (h,i) Quantification of MC1 intensity in MAP2-labeled cell bodies (h) and neurites (i) (n = 6 wells/group). MC1 data were normalized to the PGFAP::EV + PSYN::wtTau group and presented as the fold change. (j) Quantification of MAP2-positive Hoechst-stained nuclei by high-content imaging (n = 6 wells/group). NS—not significant, *p < 0.05, ****p < 0.001, Tukey multiple comparisons test following one-way ANOVA.

