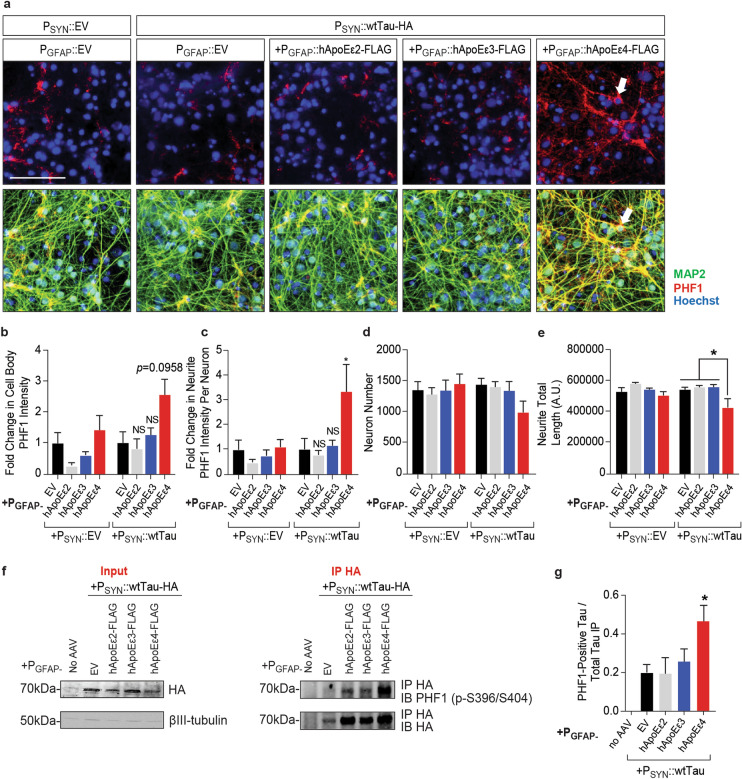
Figure 2.
Astrocytic hApoEε4 increases phosphorylation of tau within neurons. Scale bar of representative images represents 25 µM. High-content imaging and its associated quantification represents data from one independent experiment. (a) Immunocytochemistry of phosphorylated tau (PHF1) in co-cultures seven days after neuronal transduction with EV control or human tau (DIV17). AAV transduction was completed as described in (a). Cells were stained for PHF1 to visualize tau phosphorylation and MAP2 to label neurons. Hoechst stain was used to label nuclei. Arrow head points to PHF1-positive cell body and associated neurites in the PSYN::wtTau + PGFAP::hApoEε4 condition. Top panel depicts images without MAP2 imaging overlay to aid in visualization. (b,c) Quantification of PHF1 staining intensity in MAP2-labeled cell bodies (B) and neurites (d) (n = 4–6 wells/group). Data were normalized to the PGFAP::EV + PSYN::wtTau group. NS not significant, *p < 0.05, Tukey multiple comparisons test following one-way ANOVA. (e) High-content imaging to measure MAP2-positive Hoechst-labeled nuclei (n = 4–6 wells/group). (f) Quantification of the total neurite length of processes extending from MAP2-positive cell bodies (n = 4–6 wells/group). *p < 0.05, Tukey’s multiple comparisons test following one-way ANOVA. (g) Representative Western blots of immunoprecipitated HA-tagged tau (~ 70 kDa) from co-culture systems seven days after transduction with tau (DIV17) (IP HA) and the cell lysates (input) used to perform the immunoprecipitation (IP HA). HA and PHF1 antibodies were used to detect immunoprecipitated HA-tagged tau and pTau respectively. Full Western blot image can be found in Fig. S4 of Supplementary Information. (h) Quantification of band densities of Western blot depicted in panel (h) (n = 3). Data were normalized to the quantity of HA-tagged tau immunoprecipitated. *p < 0.05, Kruskal–Wallis test.

