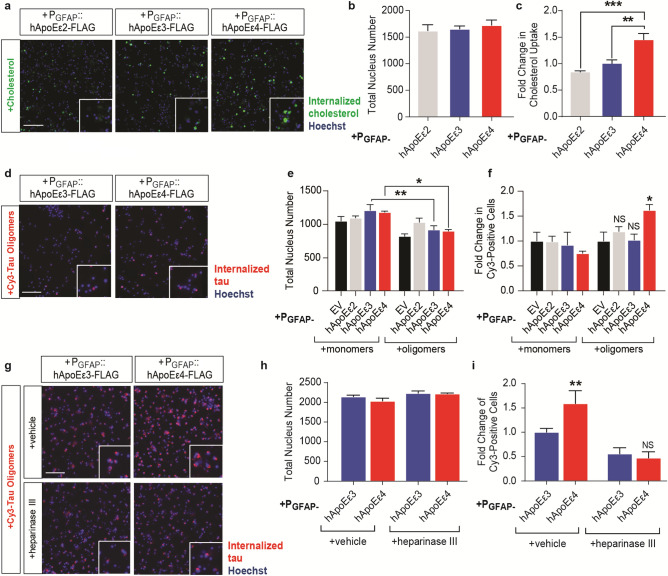
Figure 4.
Astrocytic hApoEε4 alters the dynamics of cholesterol and tau oligomer accumulation. Scale bar of representative images represents 50 µM. High-content imaging and its associated quantification represents data from one independent experiment. (a) Representative live-cell imaging of GFP-labeled cholesterol internalization one day following a 4-h incubation in co-cultures. Hoechst stain was used to visualize nuclei. (b) Quantification of Hoechst-labeled nuclei (n = 6 wells/group) in panel (a). (c) Quantification of the total GFP (cholesterol) intensity in the cytoplasm of cells by high-content image analysis. Data are depicted as fold change over PGFAP::hApoEε3 group (n = 6 wells/group). **p < 0.01, ***p < 0.005, Tukey’s multiple comparisons test following one-way ANOVA. (d) Representative live-cell imaging of cy3-tagged tau internalization 24 h following cy3-tau addition. Hoechst stain was used to visualize nuclei. (e) Quantification of Hoechst-labeled nuclei by high-content imaging (n = 5 wells/group). *p < 0.05, **p < 0.01, Tukey’s multiple comparisons test following one-way ANOVA. (f) Quantification of the number of cy3-positive cells. Data are depicted as the fold changes over respective monomer or oligomer-treated PGFAP::EV groups (n = 5 wells/group). NS not significant, *p < 0.05, Tukey’s multiple comparisons test following one-way ANOVA. (g) Representative live-cell imaging of cy3-tagged tau internalization 24 h following tau addition. Cells were pre-treated with vehicle or 150 mU heparinase III for four hours prior to cy3-tau oligomer addition. Hoechst stain was used to visualize nuclei. (h) Quantification of Hoechst-labeled nuclei by high-content imaging (n = 3 wells/group). (i) Quantification of the number of cy3-positive cells. Data are depicted as the fold change over PGFAP::hApoEε3 + vehicle group (n = 3 wells/group). NS not significant, **p < 0.01, Fisher’s LSD test following one-way ANOVA.

