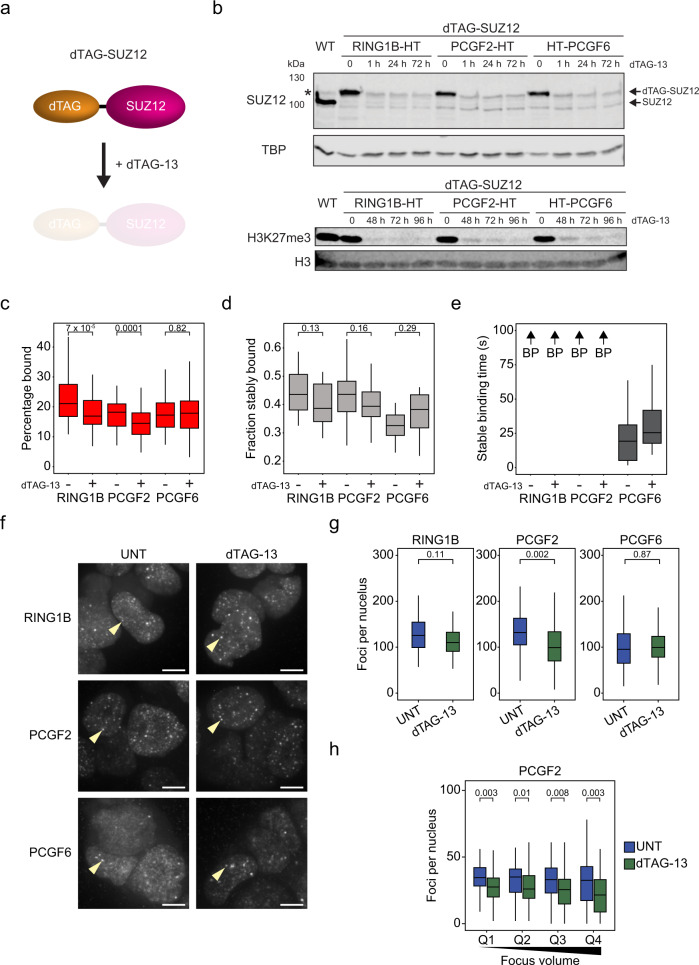
Fig. 8. PRC2 and H3K27me3 contribute to the binding frequency of canonical PRC1 but not its stability.
a A schematic illustrating the dTAG-SUZ12 system. SUZ12 is tagged endogenously and is depleted by addition of dTAG-13. b Western blots for RING1B-HT, PCGF2-HT and HT-PCGF6 cell lines with the dTAG-SUZ12 system showing rapid (<1 hr) depletion of SUZ12 and loss of H3K27me3 after 96 hrs of dTAG-13 treatment. TBP and H3 are included as loading controls. Symbol (*) indicates a nonspecific band present in the parental cell line which remains after SUZ12 depletion. n = 1 biological replicate. Source data are provided as a Source Data file. c A box plot indicating the percentage of RING1B, PCGF2, and PCGF6 molecules in the bound state with and without 96 hr dTAG-13 treatment, as determined from SPT. Box plots represent measurements from n = 90 movies from 2 experiments each. Indicated p-values were calculated using a two-tailed Student’s t test. Source data are provided as a Source Data file. d A box plot indicating the fraction of RING1B, PCGF2, and PCGF6 molecules exhibiting stable binding with and without 96 hr dTAG-13 treatment. Box plots represent measurements from n = 16 movies from 2 experiments each. Indicated p-values were calculated using a two-tailed Student’s t test. Source data are provided as a Source Data file. e A box plot indicating the stable binding times for RING1B, PCGF2, and PCGF6 with and without 96 hr dTAG-13 treatment. BP (beyond photobleaching) and an arrow indicates proteins for which stable binding exceeded the photobleaching time. Box plots represent measurements from n = 16 movies from 2 experiments each. Source data are provided as a Source Data file. f Maximum intensity projections of nuclear RING1B, PCGF2 and PCGF6 signal with and without 96 hr dTAG-13 treatment. Yellow arrowheads indicate single Polycomb bodies. Scale bar = 5 μm. n > 50 cells per condition from 2 experiments. g Box plots showing the number of Polycomb bodies detectable for RING1B, PCGF2 and PCGF6 with (green) and without (blue) 96 hr dTAG-13 treatment. n > 50 cells per condition from 2 experiments. Indicated p-values were calculated using a two-tailed Student’s t test. Source data are provided as a Source Data file. h Box plots comparing the number of nuclear foci counted for PCGF2 with (green) and without (blue) 96 h dTAG-13 treatment. Foci were divided into quartiles based on focus volumes in untreated cells. n > 50 cells per condition from 2 experiments. Indicated p-values were calculated using a two-tailed Student’s t test. Source data are provided as a Source Data file. In c–e and g–h, boxes represent the interquartile range (IQR), the middle line corresponds to the median, and whiskers extend to the largest and smallest values no more than 1.5 x IQR from the box. Values outside of this range are not plotted, but are included in all analyses.

