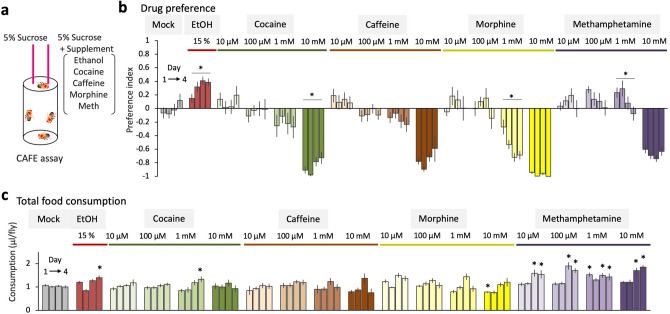
Figure 1.
The Drosophila drug intake behavior. (a) Schematics of the two-choice CAFE assay. A group of four male flies is given a choice between 5% (w/v) sucrose solution and 5% sucrose solution supplemented with drugs. Daily consumption of each solution is measured as a descent of the meniscus for 4 days. (b) Preference indices of the wild type male flies are plotted from the day 1 to the day 4. Concentration of the drug is indicated above the bar graphs. One-way repeated-measures ANOVA or the Friedman test is performed among the indices from the day 1 to 4. 15% EtOH: F (2.654, 53.08) = 6.743, P = 0.0010, n = 21 (ANOVA); 10 µM cocaine: P = 0.3013, n = 11 (Friedman); 100 µM cocaine: F (1.610, 16.10) = 0.4848, P = 0.5845, n = 11 (ANOVA); 1 mM cocaine: F (1.433, 15.76) = 0.4714, P = 0.5700, n = 12 (ANOVA); 10 mM cocaine: P = 0.0088, n = 8 (Friedman); 10 µM caffeine: F (2.482, 27.30) = 0.4237, P = 0.7012, n = 12 (ANOVA); 100 µM caffeine: F (2.047, 18.42) = 0.7174, P = 0.5042, n = 10 (ANOVA); 1 mM caffeine: P = 0.2881, n = 11 (Friedman); 10 mM caffeine: P = 0.1904, n = 10 (Friedman); 10 µM morphine: F (1.880, 15.04) = 1.546, P = 0.2448, n = 9 (ANOVA); 100 µM morphine: F (2.025, 20.25) = 2.003, P = 0.1604, n = 11 (ANOVA); 1 mM morphine: P = 0.0011, n = 11 (Friedman); 10 mM morphine: F (1.522, 15.22) = 3.251, P = 0.0773, (ANOVA); 10 µM methamphetamine: F (2.100, 29.40) = 1.166, P = 0.3277, n = 15 (ANOVA); 100 µM methamphetamine: F (2.695, 43.12) = 1.816, P = 0.1634, n = 17 (ANOVA); 1 mM methamphetamine: F (2.450, 41.64) = 4.581, P = 0.0111, n = 18 (ANOVA); 10 mM methamphetamine: P = 0.2572, n = 15 (Friedman). Bar graphs: mean ± SEM. *: P < 0.05. (c) Daily food consumption per fly. Total consumption of the control and the drug solution is plotted. Consumption of each group is compared to that of the mock group on the same day (Two-stage linear step-up procedure of Benjamini, Krieger and Yekutieli). 15% EtOH: q = 0.3330, 0.7398, 0.1127, 0.0031 (from the day 1 to 4); 10 µM cocaine: q = 0.3827, 0.9714, 0.8151, 0.1205; 100 µM cocaine: q = 0.6909, 0.8851, 0.8151, 0.1985; 1 mM cocaine: q = 0.2488, 0.8851, 0.3234, 0.0210; 10 mM cocaine: q = 0.8374, 0.9714, 0.4366, 0.5297; 10 µM caffeine: q = 0.8281, 0.9714, 0.3234, 0.2297; 100 µM caffeine: q = 0.3330, 0.6240, 0.0891, 0.1020; 1 mM caffeine: q = 0.8281, 0.8851, 0.2266, 0.0736; 10 mM caffeine: q = 0.2488, 0.8566, 0.0891, 0.6174; 10 µM morphine: q = 0.9166, 0.8851, 0.2495, 0.1985; 100 µM morphine: q = 0.6909, > 0.9999, 0.4768, 0.5297; 1 mM morphine: q = 0.0607, 0.8305, 0.3608, 0.5463; 10 mM morphine: q = 0.0295, 0.6240, 0.8151, 0.3114; 10 µM methamphetamine: q = 0.8281, 0.7398, 0.0099, 0.0051; 100 µM methamphetamine: q = 0.0609, 0.8244, 0.0002, 0.0001; 1 mM methamphetamine: q = 0.0295, 0.3329, 0.0099, 0.0068; 10 mM methamphetamine: q = 0.3330, 0.6240, 0.0003, 0.0001. Bar graphs: mean ± SEM. *: P < 0.05. Bar graphs: mean ± SEM. *: P < 0.05.

