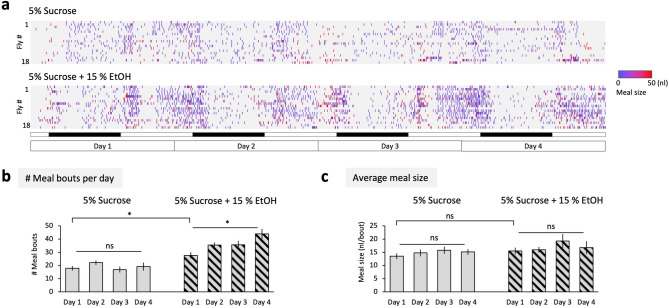
Figure 2.
Escalation of repeated intake of ethanol. (a) Raster plots of meal-bouts of 5% sucrose solution (upper) and 5% sucrose supplemented with 15% ethanol (lower). Flies are offered with both solution similar to Fig. 1. Note that flies are measured individually not to mix up the consumption of multiple flies. Level of meniscus is measured every 5 minutes and the drop bigger than mean + 2*SD evaporation is defined as a meal bout. Rows and columns respectively indicate individual flies and time bins, and the open and filled open boxes below indicate light and dark cycle (12–12 h). Size of each meal is shown with color as shown on the right. (b) The number of detected meal bouts per day. 5% sucrose: F (2.018, 34.30) = 1.408, P = 0.2585, n = 18 (one-way repeated-measures ANOVA); 5% sucrose + 15% EtOH: F (1.669, 28.38) = 7.710, P = 0.0034, n = 18 (one-way repeated-measures ANOVA). 5% sucrose vs 5% sucrose + 15% EtOH on the day 1: t = 2.698, P = 0.0152, n = 18 (paired t-test). (c) Average meal size. 5% sucrose: F (2.452, 41.68) = 0.9641, P = 0.4047, n = 18 (one-way repeated-measures ANOVA). 5% sucrose + 15% EtOH: P = 0.0719, n = 18 (Friedman test). 5% sucrose vs 5% sucrose + 15% EtOH on the day 1: P = 0.1187, n = 18 (Wilcoxon test). Bar graphs: mean ± SEM. *: P < 0.05.

