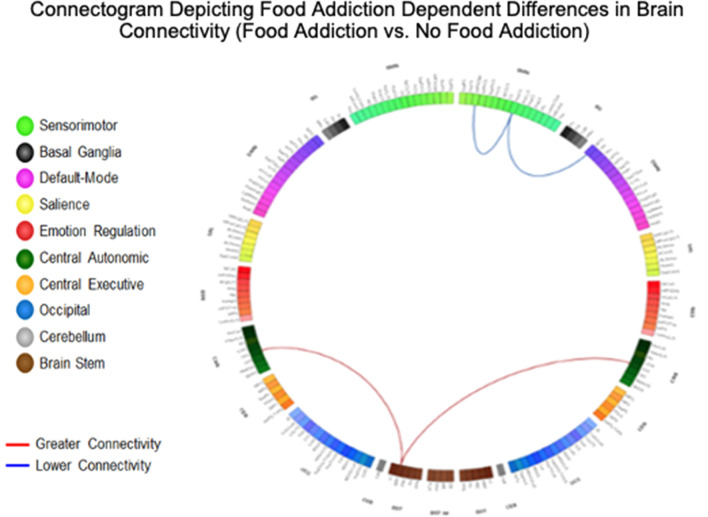
Figure 1.
Connectogram depicting food addiction dependent differences in brain connectivity (food addiction vs. no food addiction). Demonstrates significant differences in functional connectivity between individuals with food addiction and individuals with no food addiction. Analysis was performed Harvard–Oxford Subcortical atlases, the Schaefer 400 cortical atlas, and the Ascending Arousal Network brainstem atlas. Labels on the diagram are Destrieux, Harvard–Oxford Subcortical atlases, and the Ascending Arousal Network brainstem atlas equivalents. Red lines between two networks indicate greater functional connectivity, and blue lines indicate lowered functional connectivity. All connections are significant q < 0.05. Light Green: SMN (Sensorimotor Network); Black: BG (Basal Ganglia); Purple: DMN (Default Mode Network); Yellow: SAL (Salience); Red: ERN (Emotional Regulation Network); Dark Green: CAN (Central Autonomic Network); Orange: CEN (Central Executive Network); Blue: OCC (Occipital); Gray: CeB (Cerebellum); Brown: BST (Brain Stem). Bst, Brainstem; CAN, Central Autonomic Network; CEN, Central Executive Network; DMN, Default Mode Network; ERN, Emotional Regulation Network; InfFS, Inferior frontal sulcus; MFG, Middle frontal gyrus; MRF, Mesencephalic reticular formation; MTG, Middle Temporal Gyrus; OrG, Orbital gyri; PosCG, Postcentral Gyrus; SMN, Sensorimotor Network.

