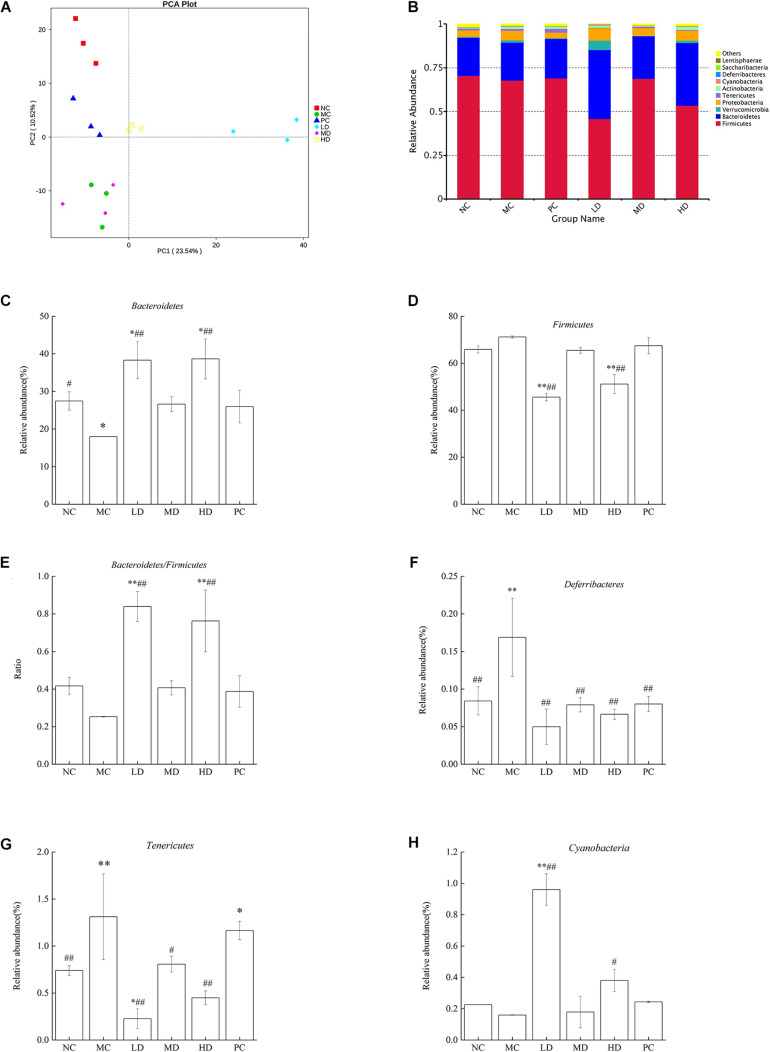
FIGURE 2.
BRS alters the composition based on OTUs and the relative abundance of gut microbiota at the phylum level. (A) Principal component analysis (PCA) of gut microbiota based on OTUs. The abscissa represents the first principal component, the ordinate represents the second principal component, and the percentage represents the contribution of the principal component to the sample difference. Each point in the figure represents a sample, and samples from the same group are represented in the same color. (B) Bacterial taxonomic profiling at the phylum level of gut microbiota. (C) Bacteroidetes, (D) Firmicutes, (E) Bacteroidetes/Firmicutes ratio, (F) Deferribacteres, (G) Tenericutes, and (H) Cyanobacteria. Differences were based on ANOVA analysis followed by LSD post hoc test and denoted in graph bars as follows: ∗p < 0.05 and ∗∗p < 0.01 compared with NC; #p < 0.05 and ##p < 0.01 compared with MC.

