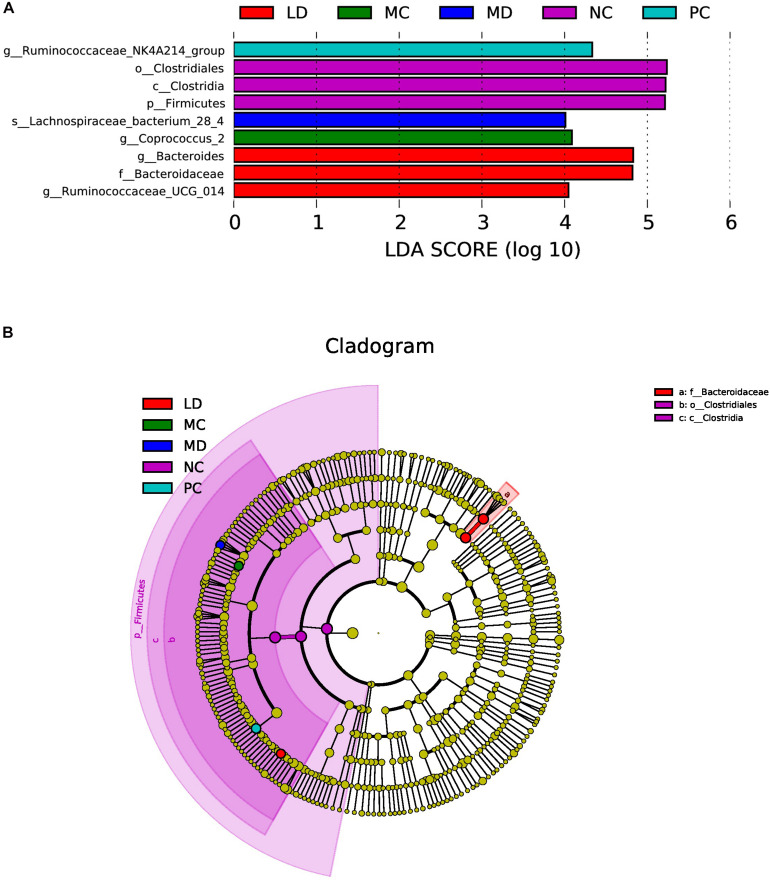
FIGURE 4.
LEfSe analysis of gut bacteria in each group. (A) Linear discriminant analysis (LDA) score plot. Species with an LDA Score threshold >4 were listed and the length of the bar chart represented the impact of different species. (B) Taxonomy cladogram. The circle of radiation from inside to outside represented the taxonomic rank from phylum to genus (or species) and the diameter of the circles was based on relative abundance.

