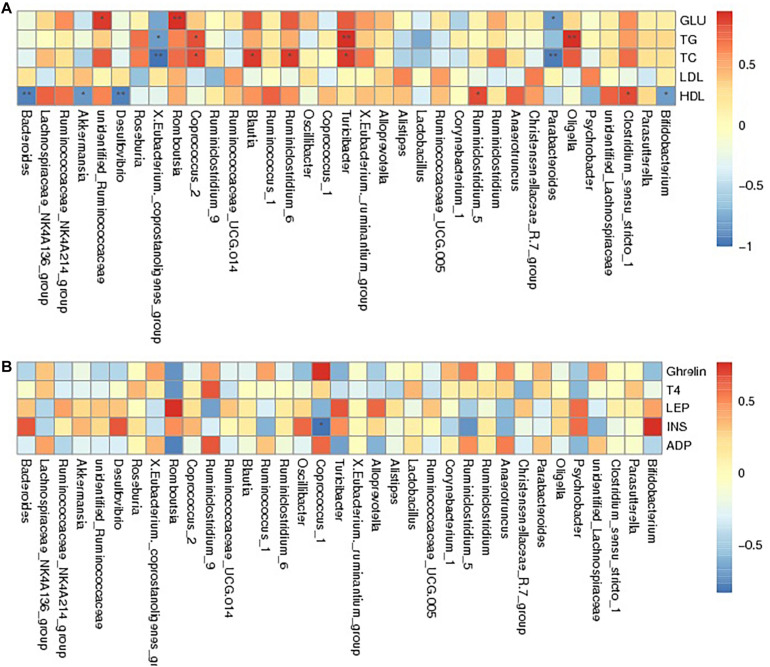
FIGURE 5.
Spearman association analysis between gut microbiota and metabolic parameters at the genus level. The depth of the color corresponded the extent of relevance between gut microbiota and metabolic parameters, red meant positive correlation and blue meant negative correlation. (A) Glucolipid metabolism parameters and (B) Serum hormone. *Correlation was significant at the 0.05 level, **Correlation was significant at the 0.01 level.

