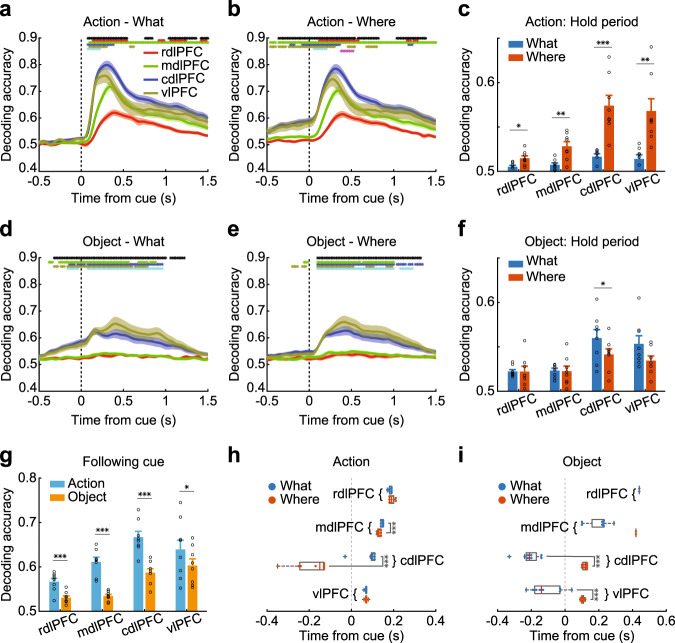
Fig. 3. Decoding of chosen action and object.
a, b, d, e The time course of decoding accuracy in each region that encoded action in What (a) or Where blocks (b), or encoded object in What (d) or Where (e) blocks. c, f The average hold period decoding accuracy in each region, when decoding action (c) or object information (f). Hold period: −0.5 to 0 s from cue onset. g The decoding accuracy in each region split by domain type, averaged from 0 to 1.5 s from cue onset. h, i The response latency of decoding accuracy in each region for encoding action (h) and object (i), split by block type. The solid circles represent the response latency of each session. Boxplot box indicates the first and third quartile, the centerline of the box indicates the median, and whisker lengths reflect the interquartile range multiplied by 1.5. Shaded zones and error bars represent mean ± SEM, n = 8 for each line, bar, or box. A two-sided t test was used to compare two populations, *p < 0.05, **p < 0.01, ***p < 0.001. The black * symbols at the top of each panel indicate a significant difference among the four regions (1-way ANOVA, p < 0.01). The red, green, blue, yellow, cyan, and magenta * symbols indicate a significant difference (two‐sided paired t test, p < 0.01) between the rdlPFC and mdlPFC, rdlPFC and dlPFC, rdlPFC and vlPFC, mdlPFC and cdlPFC, mdlPFC and vlPFC, and cdlPFC and vlPFC. Source data are provided as a Source Data file.

