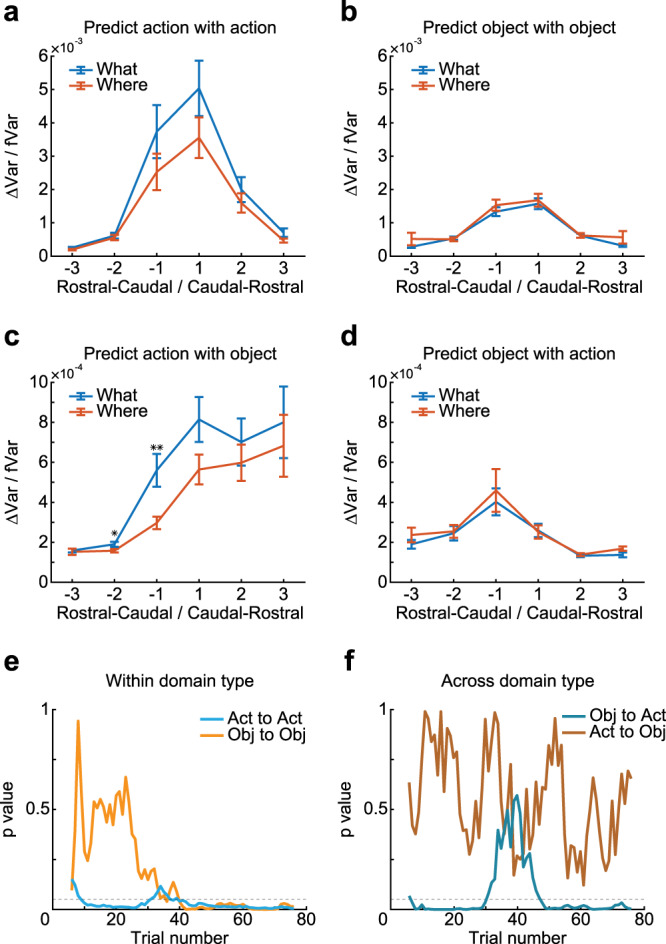
Fig. 6. Prediction of chosen action and object.

a–d Contribution of arrays separated by different ordinal distances either rostral or caudal to each array to the prediction of posterior in each array. The x-axis indicates the ordinal distance (see Fig. 1d for array number) of the arrays that were dropped in the partial model. The y-axis indicates the difference of variance explained between the Partial models (i.e., when dropping one array, bilaterally) and the Full model (ΔVar), normalized by the variance explained in the Full model (fVar). Larger values indicate a stronger prediction of the posterior from the arrays separated by distances indicated on the x-axis. The separate panels show the prediction of decoding accuracy of action with action (a), predicting object with an object (b), predicting action with an object (c), and predicting object with action (d). Rostral–caudal indicate information flow from rostral to caudal LPFC, labeled by negative ordinal distance; Caudal–rostral indicates information flow from caudal to rostral LPFC, labeled by positive ordinal distance. Error bars represent mean ± SEM, n = 32/64/96/96/64/32 for the ordinal distance of −3/−2/−1/1/2/3. A two-sided t test was used to compare two populations, *p = 0.0383, **p = 0.0032. e, f The p value of the difference in information flow between tasks (What and Where), aligned by the trial index, when doing predictions within (e) or across (f) domain type. Bin = 10 trials, step = 1 trial. Dash lines represent p = 0.05, Act represents action, Obj represents an object. Source data are provided as a Source Data file.
