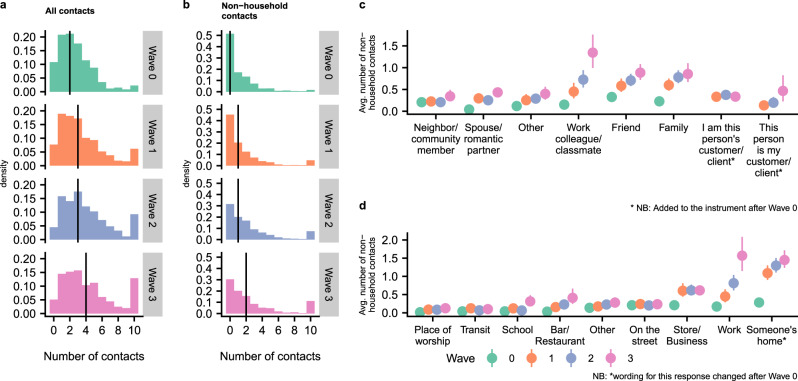
Fig. 1. Reported interpersonal contact across four survey waves.
a, b Histograms of reported number of contacts (a) and non-household contacts (b) among respondents for each wave. Reported contacts are topcoded at 10 in these plots. The vertical lines show the median number of contacts. c, d Estimated average number of non-household contacts each person reported to have taken place by contact’s relationship (c) and location (d) based on n = 29,880 reports about detailed contacts (“Methods”). Uncertainty estimates are 95% intervals derived from the bootstrap. Each point shows estimated average numbers of non-household contacts in each category, per person. For example, Panel c shows that the average respondent reported almost 0.8 non-household contacts with family members in Wave 2. Avg. average.

