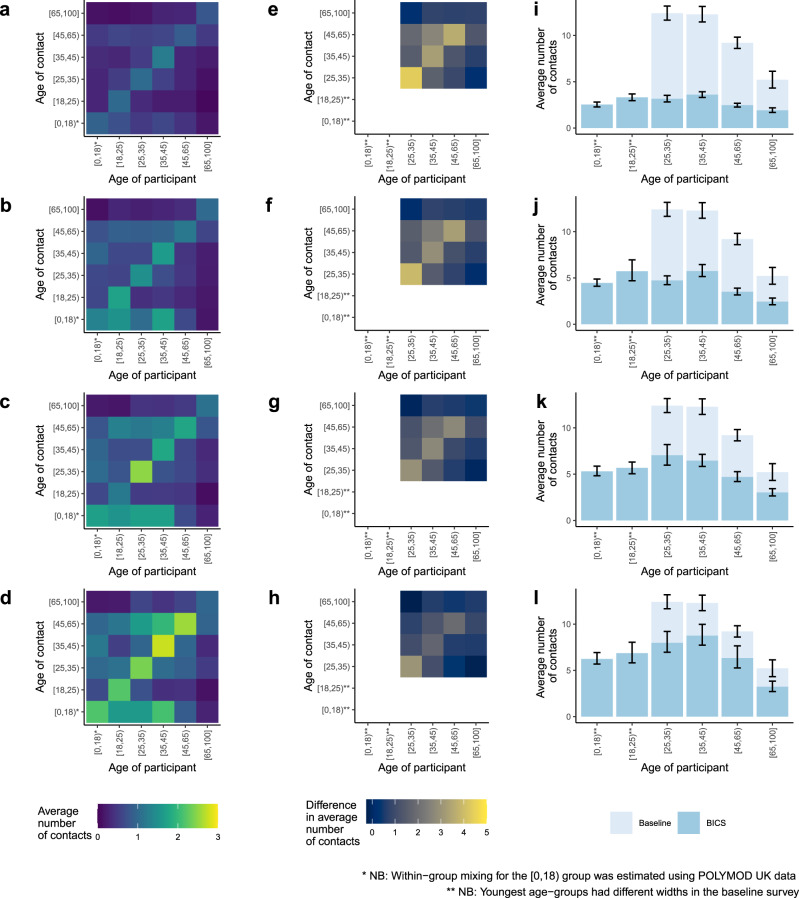
Fig. 3. Comparison of age-structured contact matrices with baseline.
a–d Age-structured contact matrices from the four BICS waves after adjusting for the age distribution of survey respondents and the reciprocal nature of contacts; lighter colors indicate higher number of average daily contacts. e–h Difference in the average number of contacts between the 2015 study and the four BICS waves; lighter colors indicate a larger absolute difference between the 2015 study and the BICS data. i–l Average number of reported contacts for each respondent age group for the BICS data (darker color) compared to the 2015 study (lighter color), along with 95% confidence intervals derived from the bootstrap. The BICS estimates are based on n = 3163 in Wave 0, n = 7473 in Wave 1, n = 7842 in Wave 2, and n = 11,402 in Wave 3 reported contacts; The 2015 study estimates are based on n = 5944 reported contacts. Top row shows BICS Wave 0; second row shows BICS Wave 1; third row shows BICS Wave 2; and bottom row shows BICS Wave 3.

