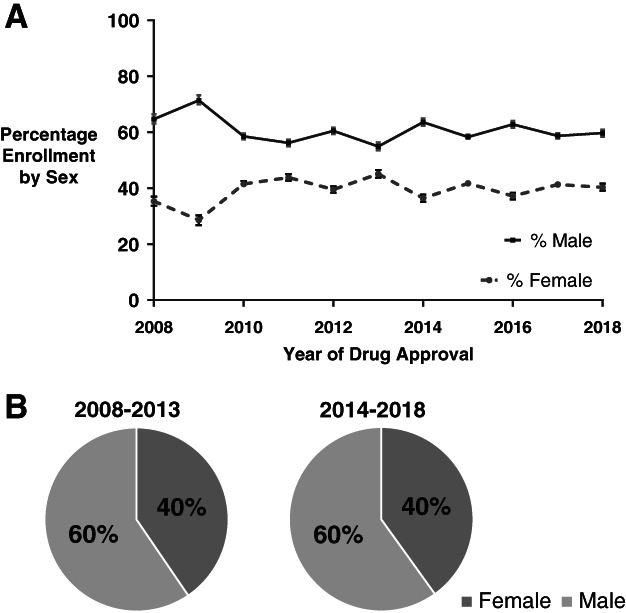
Figure 1.

Distribution of female and male trial enrollment between July 2008 and June 2018. (A): Distribution of female and male enrollment for trials leading to cancer drug approvals between July 2008 and June 2018. Sex‐specific cancers have been excluded. (B): Distribution of female and male enrollment in trials associated with drug approvals that occurred between 2008 and 2013 and 2014 and 2018 did not differ (odds ratio, 1.02; 95% confidence interval, 0.99–1.05; p = .25).
