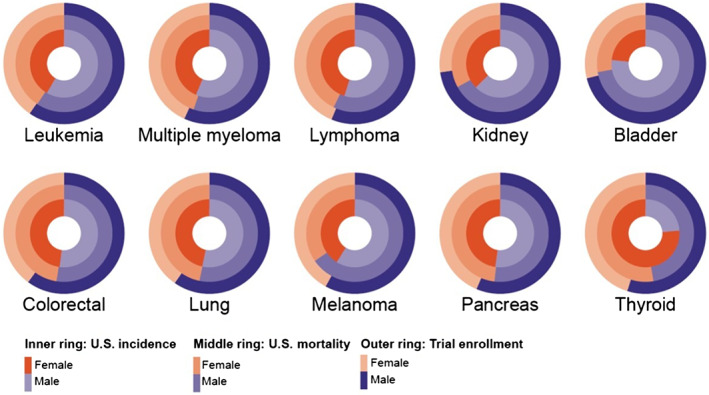
Figure 3.

Female and male distribution across U.S. incidence, U.S. mortality, and trialenrollment across 10 tumor types. Graphical representation of the ratio of female to male (female/male) within trials leading to U.S. Food and Drug Administration drug approvals during the period reviewed for the 10 most common tumor types in the US. The inner ring denotes the female/male U.S. incidence for the tumor type denoted below the circle, and the middle ring denotes female/male U.S mortality for that tumor type. The outer ring of each circle represents female/male enrollment across all trials for that tumor type.
