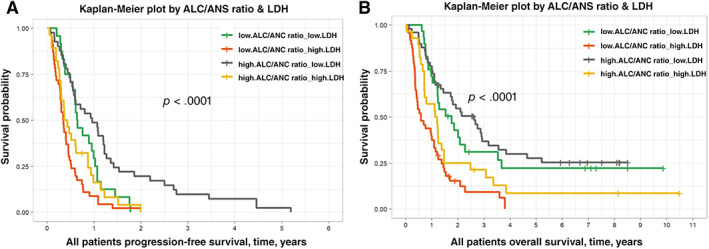
Figure 1.

Kaplan‐Meier plots of progression‐free and overall survival. (A): Progression‐free survival stratified by serum LDH and serum ALC/ANC ratio. This figure shows the progression‐free survival was best in patients with low serum LDH values and high ALC/ANC ratio upon initiation of targeted therapy while poorest in patients with high serum LDH and low ALC/ANC ratio. The differences in these curves serve as a potentially useful stratification guide for patients beginning targeted therapy. (B): Overall survival stratified by serum LDH and serum ALC/ANC ratio. This figure shows the overall survival was best in patients with low serum LDH values and high ALC/ANC ratio upon initiation of targeted therapy while poorest in patients with high serum LDH and low ALC/ANC ratio. The differences in these curves serve as a potentially useful stratification guide for patients beginning targeted therapy.Abbreviations: ALC, absolute lymphocyte count; ANC, absolute neutrophil count; LDH, lactate dehydrogenase.
