
Figure 1.
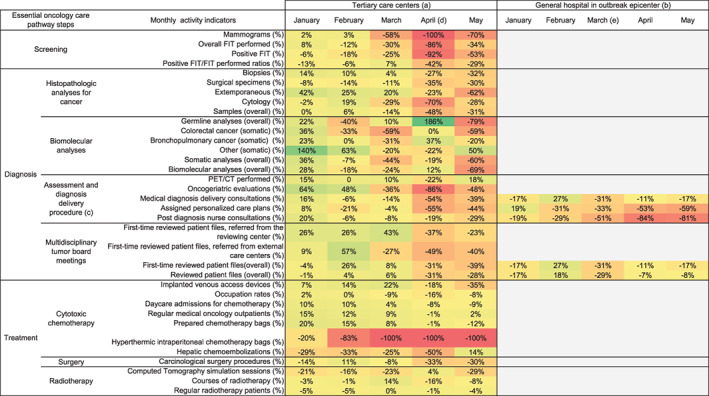
Monthly oncological activity volume difference between 2019 and 2020. Monthly changes in volume of oncological activities (%) are calculated with (2020 activity – 2019 activity) / 2019 activity and are illustrated through color variation from green (rising activity) to red (decreasing activity). Grey areas show unavailable data for the first analyses of the study. Further data collection is still in progress. (a) Reims University Hospital and Cancer Institute (Grand East region in France). (b) Colmar General Hospital (Grand East region in France). (c) Diagnosis announcement procedure (3 steps) is a measure of the first French cancer plan (2003‐2007). (d) Overall inpatients peak in Reims (April 5, 2020). (e) Overall inpatients peak in Colmar (March 24, 2020)
Abbreviations: FIT, fecal immunochemical test; PET/CT, Positron emission tomography with computed tomography.