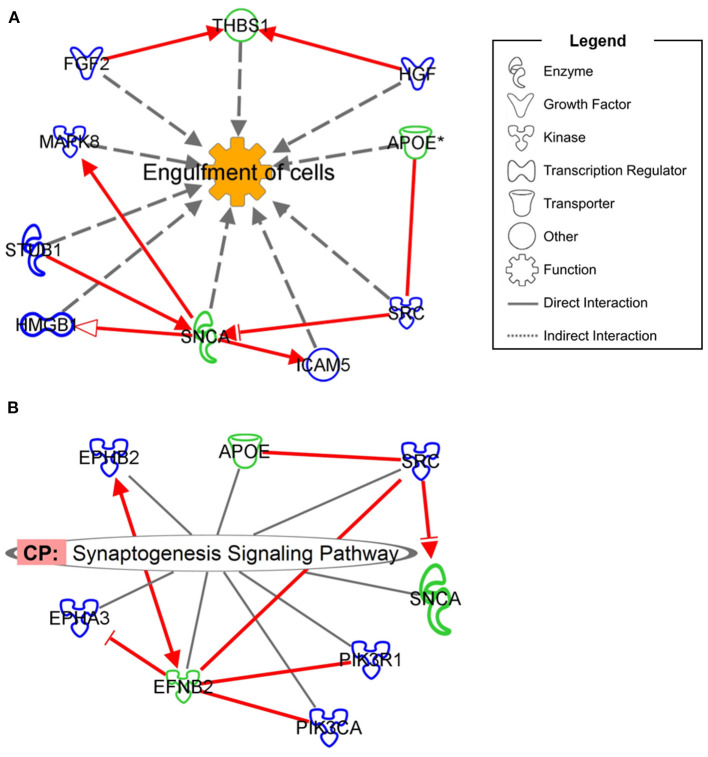
Figure 3.
Interaction network showing the mutual involvement of DEPs from SACS KO model and ARSACS patients in Engulfment of Cells (A) and Synaptogenesis Signaling Pathway (B). DEPs in patients are shown with green outlining while DEPs in the neuroblastoma model are shown with blue outlining. Only direct interaction between DEPs belonging to different models and involved in neurological disease was considered eligible (red arrows).

