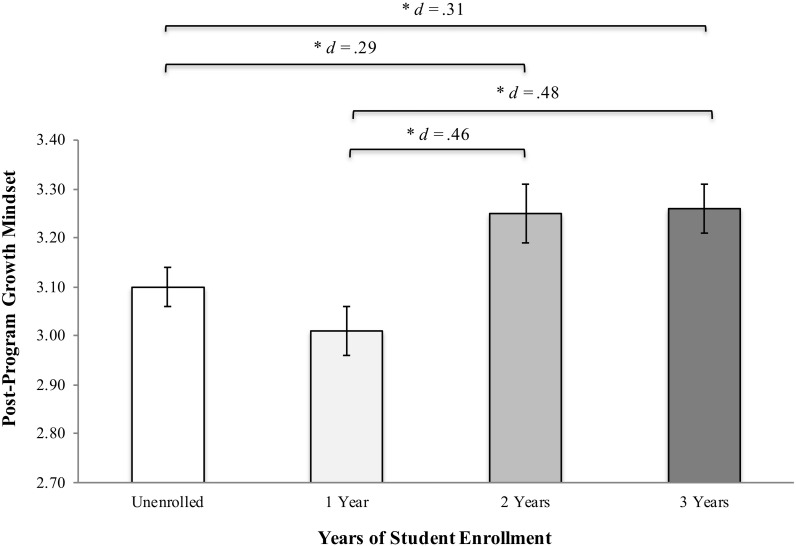
FIGURE 1.
Post-program overall growth mindset scores by years of student enrollment. Note that the brackets indicate significant Tukey-adjusted contrasts (∗p < 0.05), and d values correspond to effect sizes calculated by dividing the difference in the model-implied estimates for each pair of groups by the pooled standard deviation of pre-program overall growth mindset scores.

