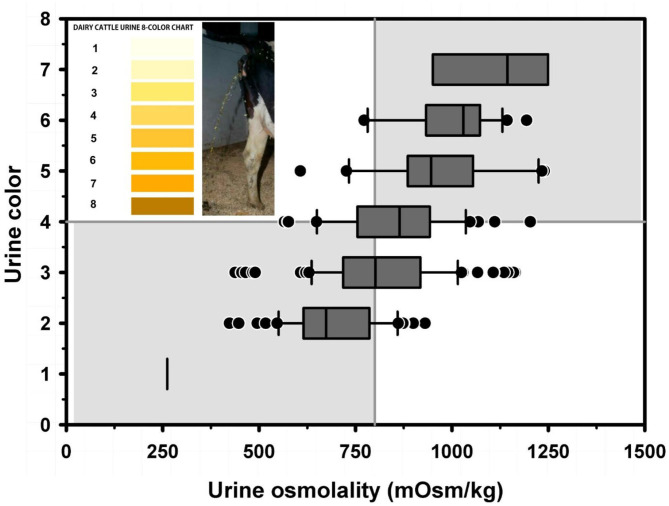
Figure 3.
Box and whiskers plot of the association between urine color (8 levels) and urine osmolality (UOsm; reference method) for 237 urine samples obtained periodically from 20 multiparous periparturient Holstein-Friesian cows. The solid gray vertical line indicates the recommended cut point for UOsm (≥800 mOsm/kg) for diagnosing dehydration. The solid gray horizontal line indicates the optimal cut point for color (≥4) identified by logistic regression for diagnosing dehydration. See Figure 2 legend for additional information. Figure modified with permission from: Megahed et al. (5).

