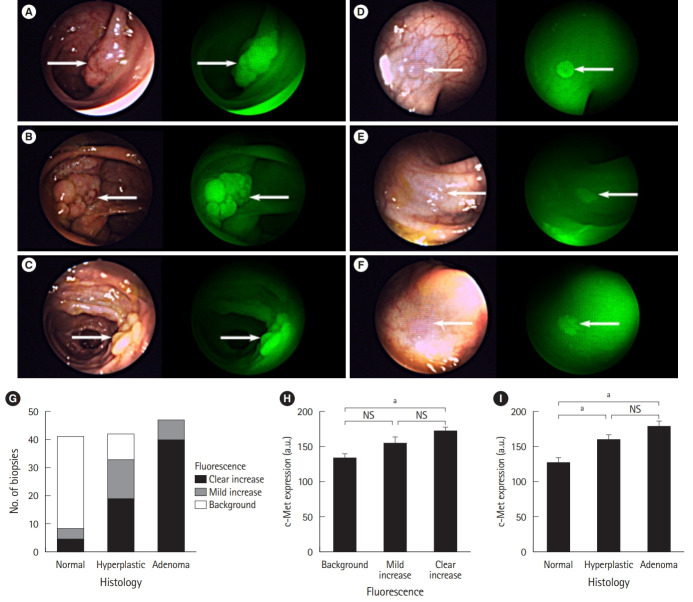
Fig. 1.
Simultaneous white light (WL) and fluorescent light (FL) images of representative lesions of various morphological and histological subtypes found. (A-C) The lesions shown are clearly visible in WL and show clearly increased fluorescence. (D) A lesion that, although it was visible in WL, had enhanced visibility in FL. (E, F) Images representative of the 9 lesions that were only visible in FL. Polyps are indicated by the white arrows. (A) A 2-cm pedunculated (Paris 0-Ip) tubular adenoma. (B) A 4-cm subpedunculated (Paris 0-Isp) tubulovillous adenoma. (C) A 2-cm sessile (Paris 0-Is) serrated polyp. (D) A 5-mm flat elevated (Paris 0-IIa) tubular adenoma. (E, F) Flat (Paris 0-IIb) tubular adenomas, 5 mm and 4 mm in diameter, respectively. (G) Graph showing the relationship between the degree of fluorescence and the histological diagnosis. (H) Graph showing the relationship between c-Met expression and the degree of fluorescence. (I) Graph showing the relationship between c-Met expression and histological diagnosis. Error bars are means±standard error of the mean. aP<0.001, mixed-model analysis of variance. Adapted from Burggraaf J, et al. Nat Med 2015;21:955-961, with permission from Springer Nature [23].

