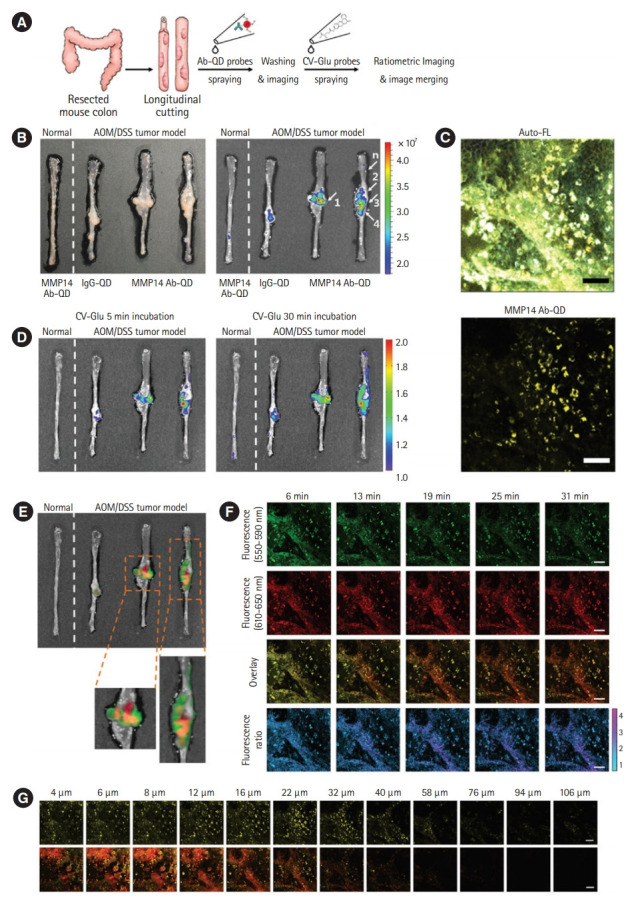
Fig. 2.

(A) Schematic diagram of sequential ex vivo staining with crystal violet (CV)-glutamic acid (Glu) and matrix metalloproteinases 14 (MMP14) antibody-quantum dot (Ab-QD) probes. (B) White light images (left panel) and in vivo imaging system images (right panel) of (from left) a normal colon tissue treated with the MMP14 Ab-QD probe, a tumor tissue treated with IgG-QD conjugates, and two other tumor colons treated with the MMP14 Ab–QD probe. Five regions were histopathologically analyzed (arrows 1, 2, 3, 4, and n). (C) Twophoton microscopy (TPM) images of mouse tumor colon stained by the MMP14 Ab-QD probe. Upper image: autofluorescence (Auto-FL) imaging, lower image: MMP14 Ab-QD probe signals (yellow pseudo-color). (D) Ratiometric signals after spraying all tissues with the CV-Glu probe at 5 and 30 minutes after treatment. (E) Overlay images of the CV-Glu probe radio frequency signal at 30 minutes (green pseudo-color) and MMP14 Ab-QD probe signal (red pseudo-color). (F) Time-dependent TPM images of the CV–Glu probe in the same area shown in panel (C). First row: CV–Glu; second row: CV; third row: overlay images; fourth row: ratiometric images. (G) TPM fluorescence images recorded moving down in the z-direction. First row: MMP14 Ab-QDs (yellow pseudo-color); second row: overlay images of CV-Glu probe. Scale bar: 50 µm. AOM, azoxymethane; DSS, dextran sodium sulfate. Adapted from Park Y, et al. Acs Nano 2014;8:8896-8910, with permission from John Wiley and Sons [24].
