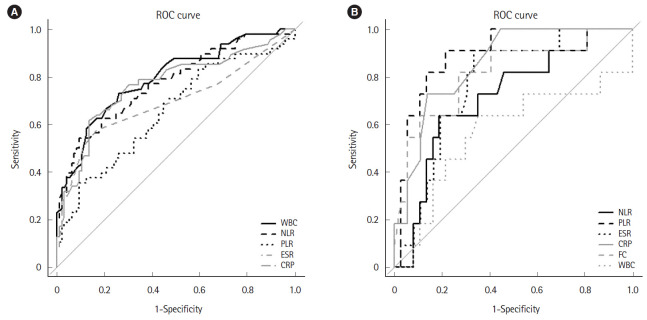
Fig. 2.
ROC curve showing the diagnostic performance of NLR, PLR, and FC. (A) In the ROC curve, the optimal cutoff value for NLR and PLR for detecting UC was 2.26 (sensitivity 54.2%; specificity 90.6%; AUC 0.774, 95% CI 0.690–0.859) and 179.8 (sensitivity 35.4%; specificity 90.6%, AUC 0.654, 95% CI 0.556–0.753). (B) The optimal cutoff value for NLR, PLR, and FC for differentiating UC severity were 3.44 (sensitivity 63.6%; specificity 81.1%; AUC 0.714, 95% CI 0.539–0.888), 175.9 (sensitivity 90.9%; specificity 78.4%; AUC 0.897, 95% CI, 0.802–0.992), and 453 μg/g (sensitivity 81.8%; specificity 73.0%; AUC 0.813, 95% CI, 0.655–0.972), respectively. ROC, receiver operator characteristic; NLR, neutrophil to lymphocyte ratio; PLR, platelet to lymphocyte ratio; FC, fecal calprotectin; UC, ulcerative colitis; AUC, area under the curve; CI, confidence interval; WBC, white blood cell; ESR, erythrocyte sedimentation rate; CRP, C-reactive protein.

