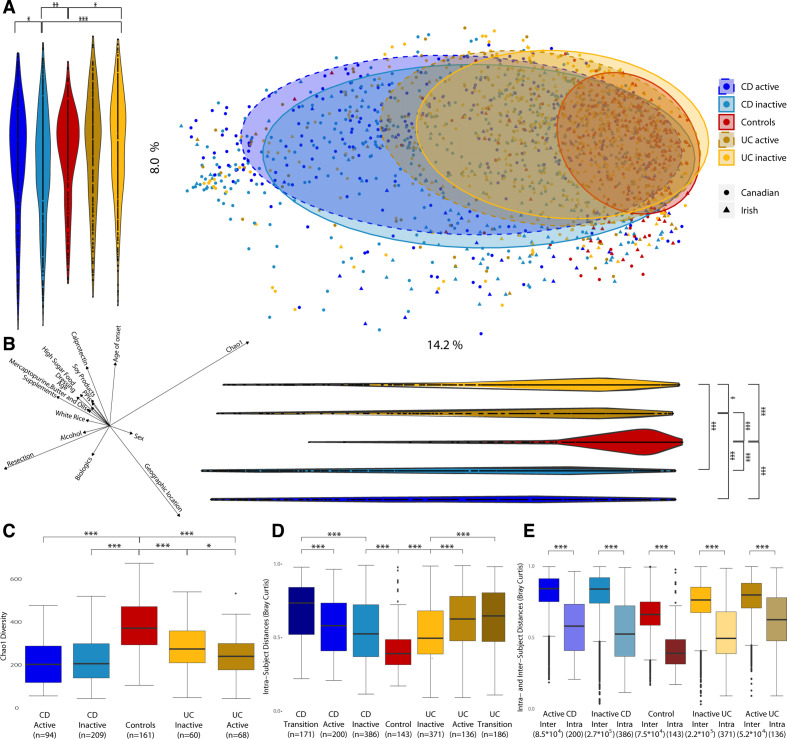
Figure 1.
Microbiota composition and diversity in Crohn’s disease (CD), ulcerative colitis (UC) and control subjects. (a) Principal coordinates analysis (PCoA) based on Bray-Curtis distances with proportional normalisation on all operational taxonomic units (OTUs) present in >5% of samples, with samples grouped by disease and activity state. Violin plots show projections of PCoA points into PC1 and PC2. (b) Spearman’s correlations between PC axes and food groups/metadata and alpha diversity. Only categories with significant correlations are represented. The direction and length of the arrows indicate the direction and strength of the correlation. (c) Comparison of Chao1 alpha diversity for disease type and status of patients with IBD vs healthy controls.(d) Comparison of distances between time points from the same subject based on intra-individual Bray-Curtis distances. (e) Comparison of intra-individual and inter-individual Bray-Curtis distances. *p<0.05; **p<0.01; ***p<0.001.

