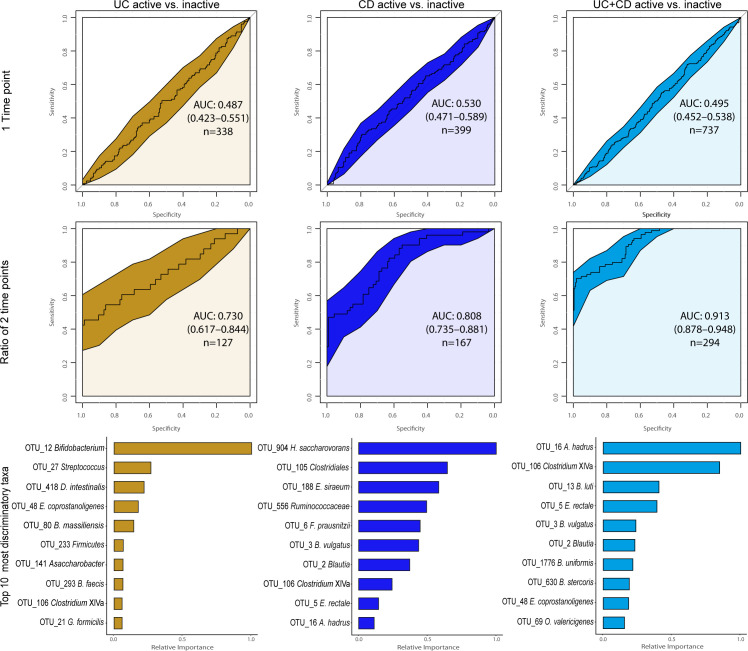
Figure 4.
Single and dual time-point machine learning classification of disease activity for patients with Crohn’s disease (CD) and ulcerative colitis (UC) separately and combined cohorts based on proportional normalised operational taxonomic units (OTUs) present in >5% of samples. The receiver operating characteristics (ROC) curves for the boosted tree models on the second row were generated based on the ratio of each OTU between two consecutive time points. Only subjects that did not transition between disease states were included, Canadian and Irish combined. Below each ROC curve are variable importance displayed indicating the relative importance for the 10 OTUs with the highest gain for each model.

