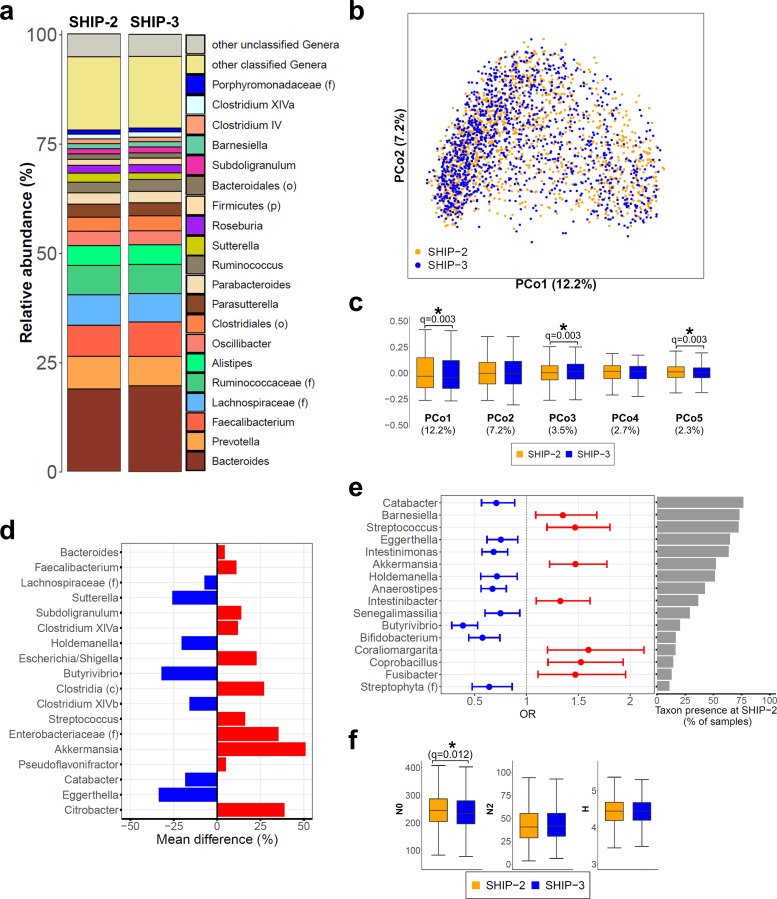
Figure 2.
Stability of the faecal microbiome from Study of Health in Pomerania (SHIP)-2 to SHIP-3. (A) Stacked bar plots show the average faecal microbiota composition at SHIP-2 and SHIP-3. (B) Principal coordinate analysis (PCoA) of 2564 faecal microbiota samples obtained from 1282 individuals at SHIP-2 (orange dots) and SHIP-3 (blue dots). (C) Boxplots display the PCo1–PCo5 scores comparing SHIP-2 (orange boxes) to SHIP-3 (blue boxes) samples. Numbers in brackets below denote the percentage of variation explained by the respective PCo. The overall faecal microbiome landscape was quite stable from SHIP-2 to SHIP-3 with small but significant shifts along PCo1, PCo3 and PCo5. (D) Shown are the percentage changes in abundance of the 18 taxa with a significant increase (red) or decrease (blue) in abundance over time. All taxa are ordered according their mean abundance at SHIP-2 from top (most abundant) to bottom (least abundant). (E) Analysis of the taxon presence distribution from SHIP-2 to SHIP-3. Shown are the ORs and their respective 95% CIs at SHIP-3 compared with SHIP-2 as baseline of all 16 taxa with significant changes in their presence profiles. An OR over 1 indicates an increased likelihood for the respective taxon to be present in a SHIP-3 sample if it was not present in the same subject at SHIP-2, whereas an OR below 1 implies the loss of the respective taxon in SHIP-3 samples compared with SHIP-2. All taxa are ordered according to the percentage of samples with presence of the respective taxon at SHIP-2 from top (high presence) to bottom (low presence). (F) Comparison of alpha diversity between SHIP-2 and SHIP-3. Species richness (N0) was slightly reduced at follow-up, whereas no change was observed in Simpson diversity number (N2) or Shannon diversity index (H). Whiskers are drawn up to 1.5 times the IQR (outliers not shown). *Indicates significant difference. c, class; f, family; o, order; p, phylum.

