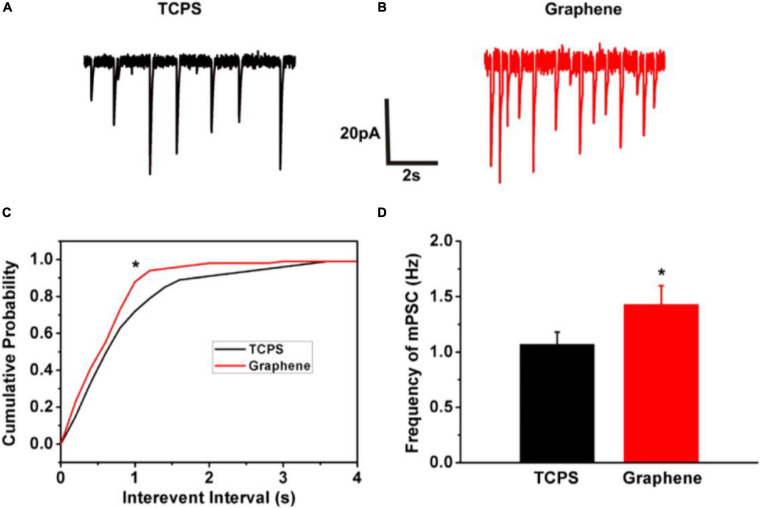
FIGURE 9.
Graphene substrate increases miniature synaptic activity. (A,B) Representative miniature synaptic currents (mPSCs) are shown in both TCPS and graphene groups; (C) Cumulative probability plots of inter event interval and amplitude of mPSCs were presented in both TCPS and graphene groups. Histogram plots of mPSC frequency (D) and amplitude (C) were to identify the difference of selected index. Note the significant increase in the mPSC frequency (*p < 0.05) and no difference in the mPSC amplitude. Reprinted from Tang et al. (2013) Elsevier ltd.

