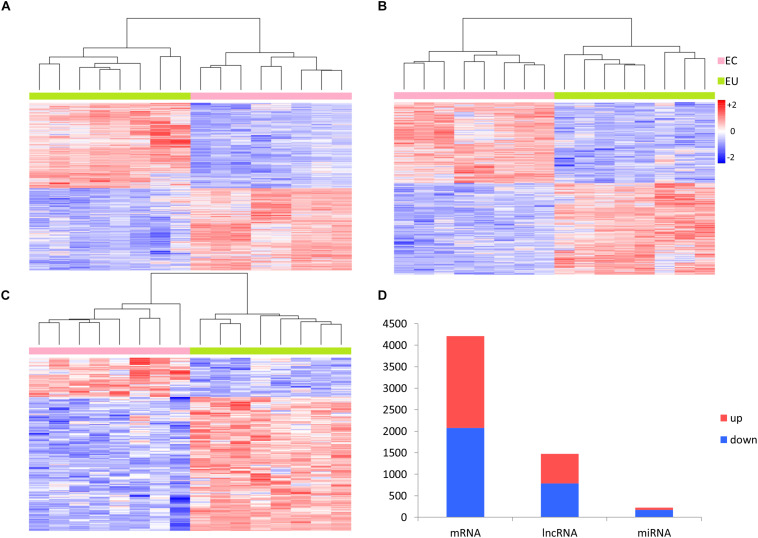
FIGURE 2.
Differential expression analysis of RNAs. Heat-map generated by unsupervised clustering shows differentially expressed (A) mRNAs, (B) lncRNAs, and (C) miRNAs. (D) Distribution of upregulated and downregulated RNAs in ectopic endometrial samples vs. eutopic endometrial samples. EC, ectopic endometrial samples; EU, eutopic endometrial samples; Up, upregulated; Down, downregulated.

