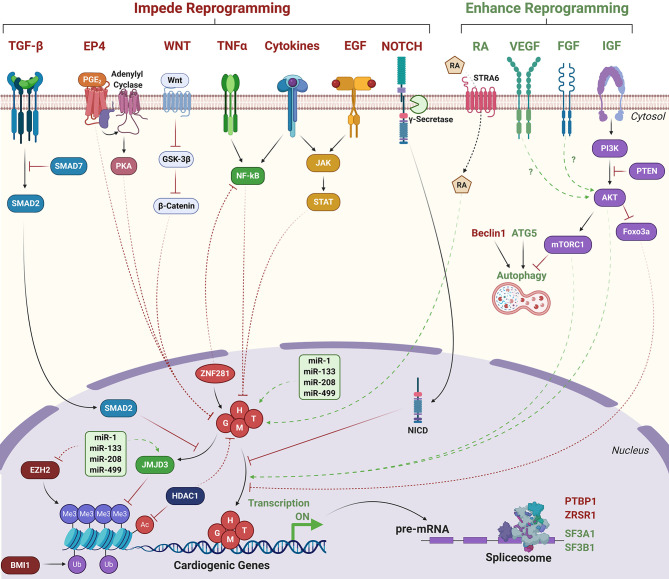
Figure 3.
Signaling pathways that influence direct cardiac reprogramming. Green text/arrows indicate pathways that enhance reprogramming. Red text/arrows indicate pathways that negatively regulate reprogramming. Solid lines indicate direct interactions. Dashed lines indicate indirect or hypothesized interactions. G, H, M, T, GATA4, HAND2, MEF2C, TBX5; RA, Retinoic acid; NICD, Notch intracellular domain. Transcriptionally repressive histone marks: Me3; H3K27me3. Ub; H2AK119 ubiquitination. Transcriptionally activating histone marks: Ac, histone acetylation.

