
Figure 5.
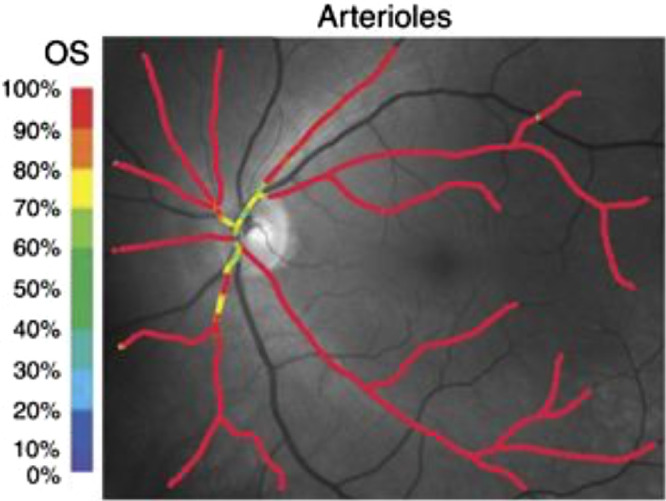
Color-coded oximetry maps using hyperspectral imaging technology display different patterns for comparison in a healthy subject (upper row) and a subject with BRAO (lower row). In this subject with BRAO, lower oxygen saturation is observed in the inferotemporal territory of the retina. Reproduced with permission from Mordant et al.56 © 2011 Macmillan Publishers Limited.