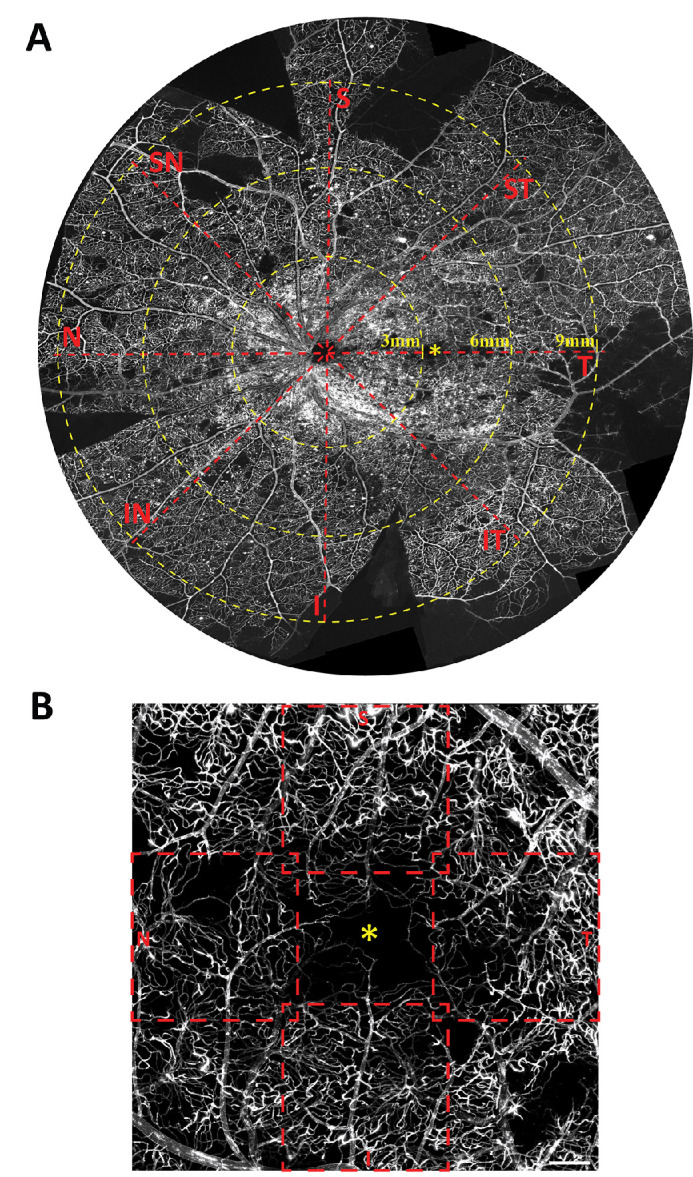
Figure 1.

Whole-mount histologic image of a diabetic donor retina labelled with lectin-FITC illustrates the retina regions that were studied (A). The superimposed grid is centered on the optic disc. Confocal Z-stacks of 1.24 mm × 1.24 mm were sampled at each 3-mm, 6-mm, and 9-mm eccentricities in eight directions. The parafovea region (B) was sampled in four separate locations – superior, temporal, inferior and nasal to the foveal avascular zone (*). I, inferior; IN, inferonasal; IT, inferotemporal; N, nasal; S, superior; SN, superonasal; ST, superotemporal; T, temporal. Scale bar = 300 µm.
