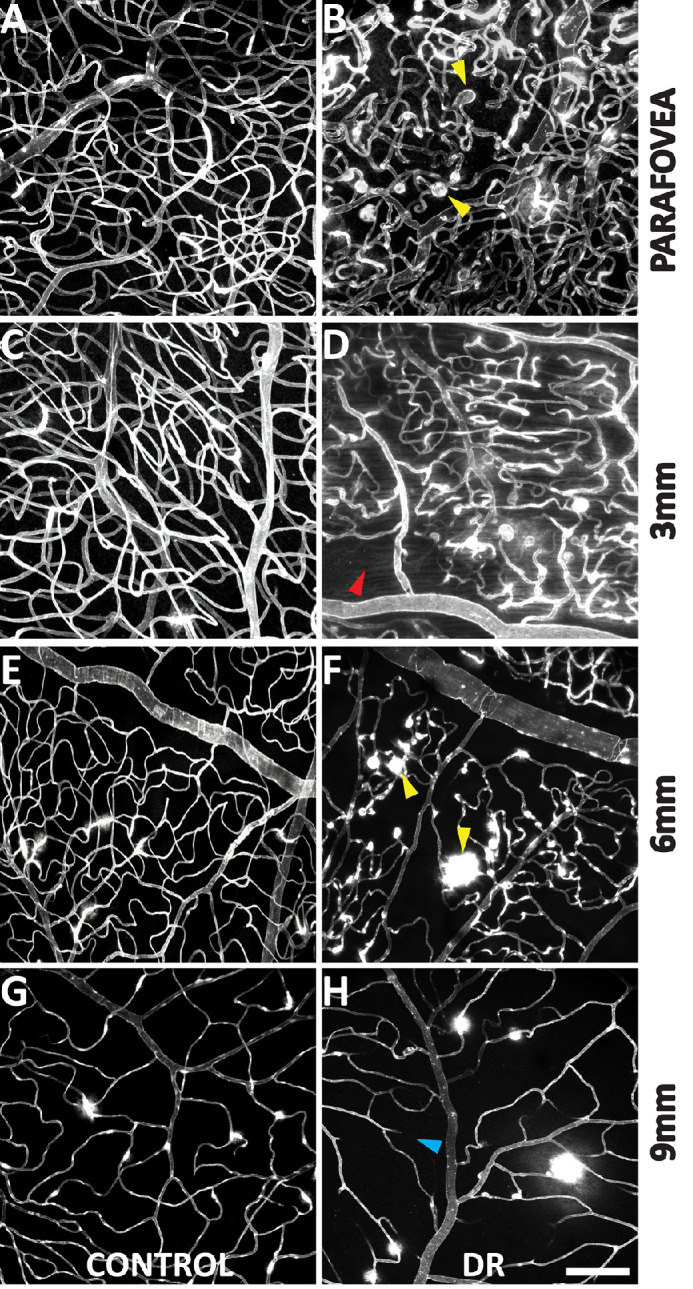
Figure 3.

Capillary density comparison between control and DR groups at each retina location. Each image depicts a Z-projection of all capillary plexuses of a full thickness confocal microscopy stack. Capillary density was significantly less in the 3-mm and 6-mm locations in the DR group. Microaneurysms are indicated in panels B and F (yellow arrows). Panel D highlights an area of capillary dropout (red arrow). Panel H (blue arrow) highlights an occluded retinal vessel. Scale-bar = 100µm.
